The 10 Windiest Cities in the United States
In climatology, “windy” refers to long-term average sustained wind speeds, not just an occasional storm. Wind affects more than just the weather forecast. It shapes daily commutes, air travel schedules, renewable energy output, and even outdoor safety. The data used for this article comes from NOAA’s National Centers for Environmental Information (NCEI) using 1991-2020 Climate Normals. This information is validated with Weather Spark.
The analysis focuses on primary ASOS stations at city airports, such as Chicago O’Hare International Airport and Boston Logan International Airport. To draft this article, we also researched annual mean wind speed, monthly averages, prevailing wind directions, frequency of calm conditions, and peak gust climatology in depth. All cities in this article have a population of above 50,000 and under 715,000, with Oklahoma City being the most populous at 712,919 as of 2025 demographics.
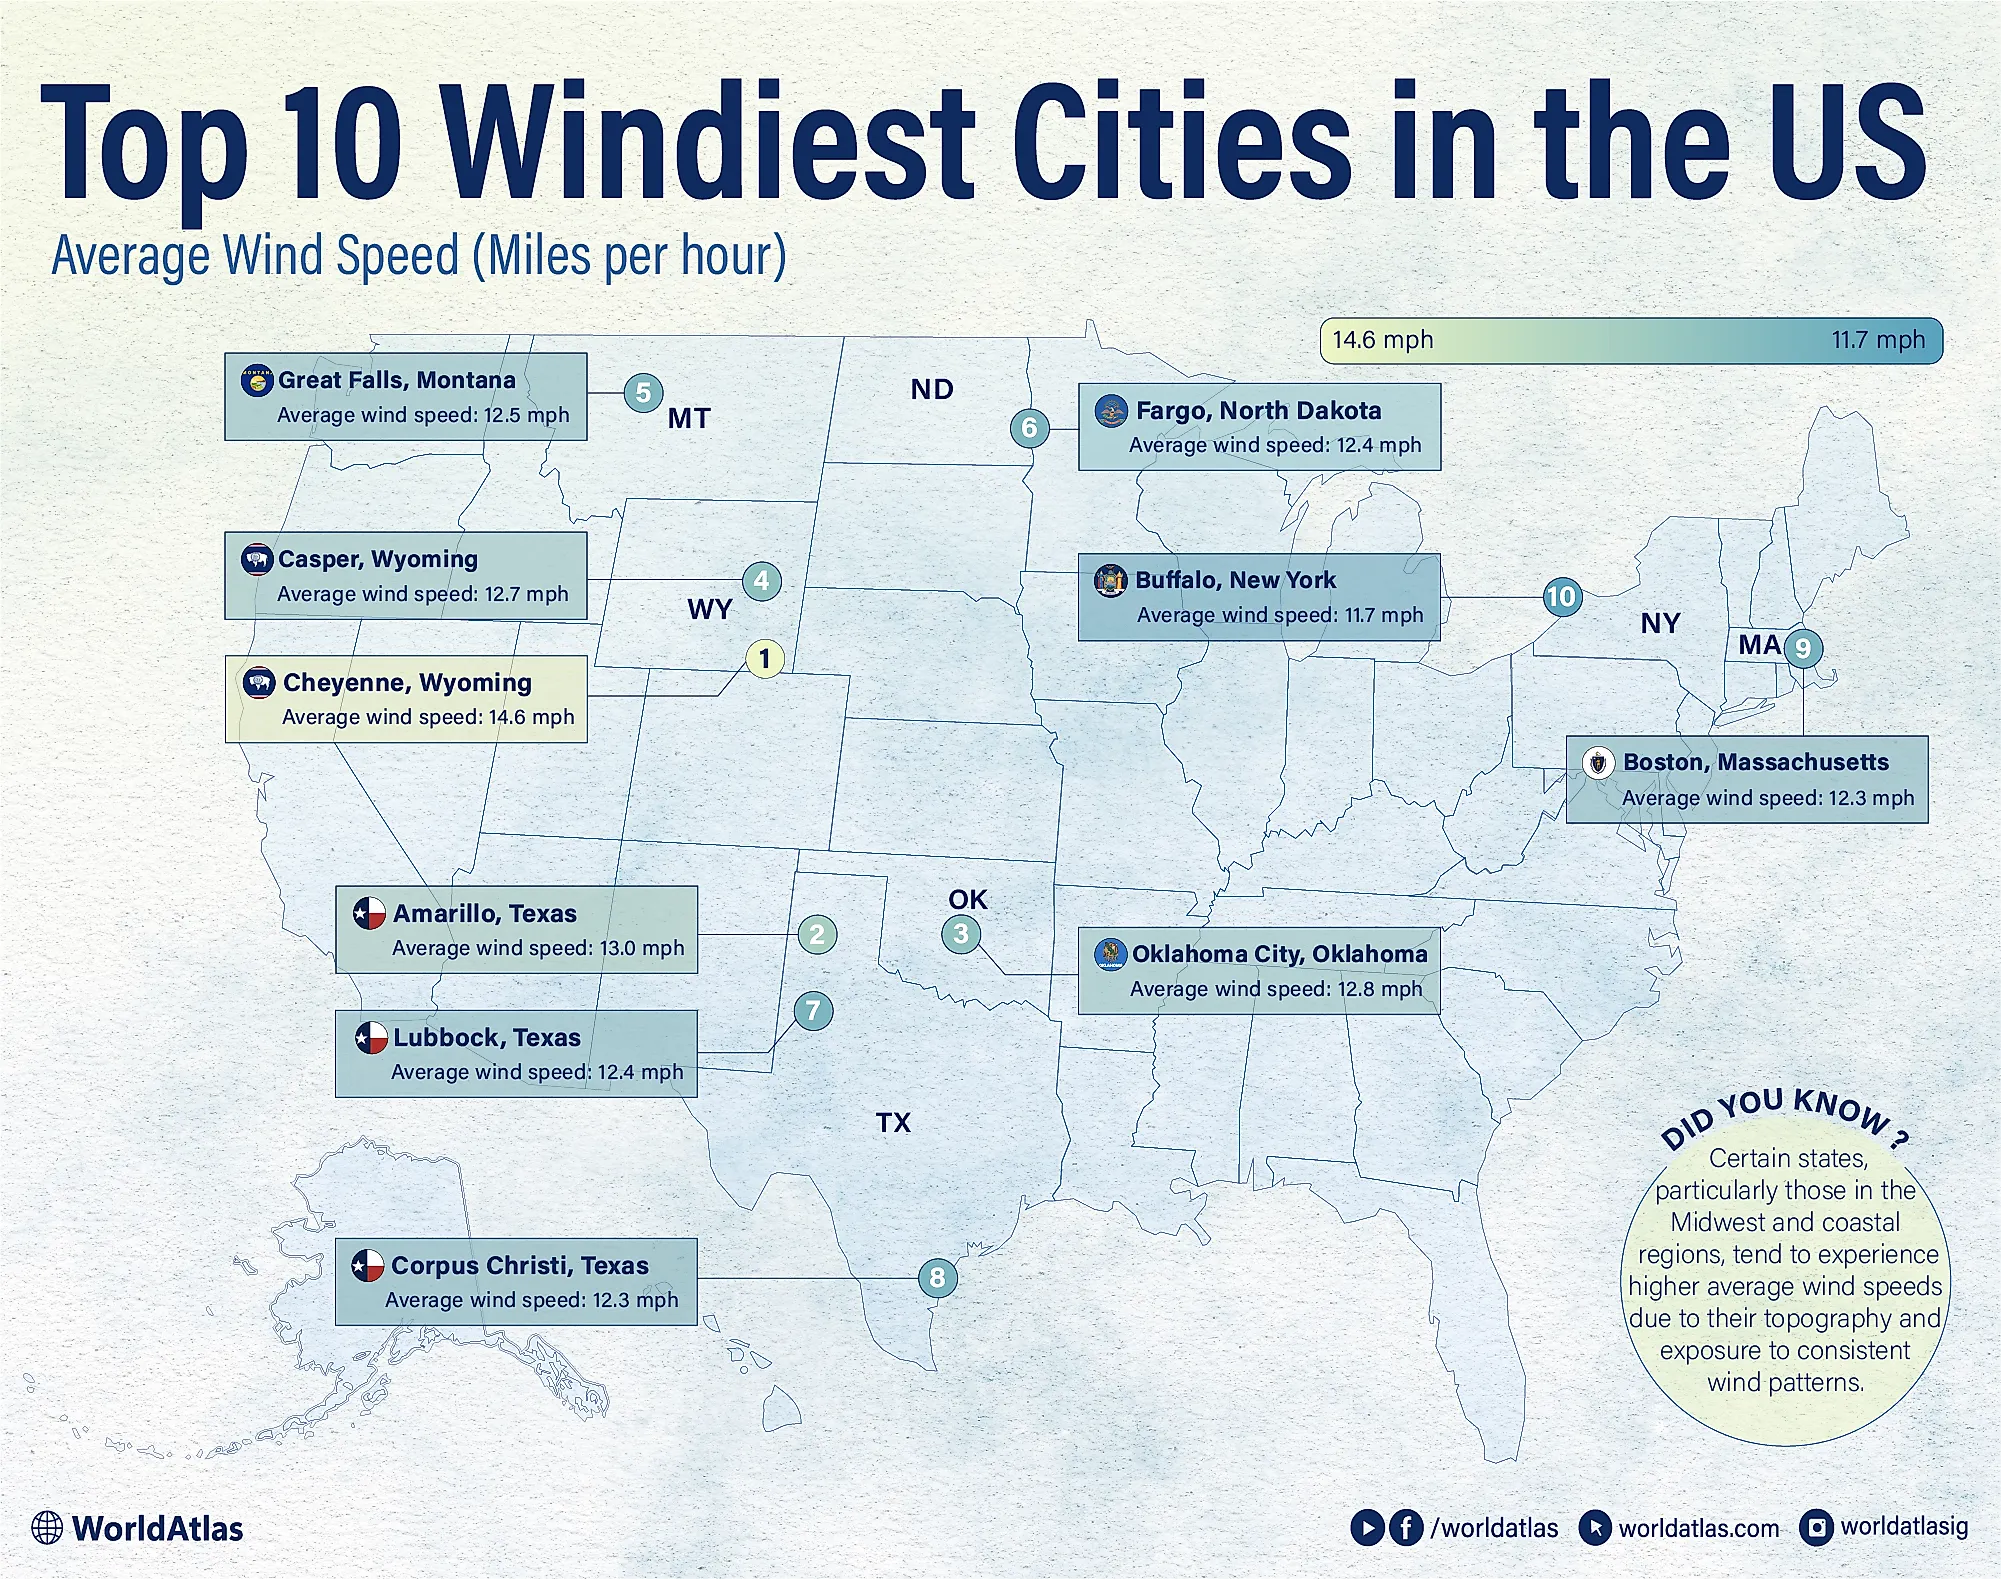
Top 10 Windiest Cities in the US
| City, State | Average Wind Speed (mph) |
|
Buffalo, New York |
11.7 |
|
Boston, Massachusetts |
12.3 |
|
Corpus Christi, Texas |
12.3 |
|
Lubbock, Texas |
12.4 |
|
Fargo, North Dakota |
12.4 |
|
Great Falls, Montana |
12.5 |
|
Casper, Wyoming |
12.7 |
|
Oklahoma City, Oklahoma |
12.8 |
|
Amarillo, Texas |
13.0 |
|
Cheyenne, Wyoming |
14.6 |
Amarillo, Texas

Amarillo sits at about 3,600 feet on the Llano Estacado and has roughly 200,000 residents. Long-term NOAA data show an annual mean wind speed of 13.0 mph, with April the windiest month. Calm conditions are uncommon, roughly one quarter of observations, and the airport has logged peak gusts above 80 mph. Spring brings the strongest sustained winds and dust. Winter cold fronts can create sharp, gusty shifts. Late summer is typically the quietest stretch. Extreme events include blizzard winds, dust storms, and fast-moving derechos.
Lubbock, Texas

Lubbock is located on the Caprock Escarpment, where flat, open terrain gives wind plenty of space to build speed. According to NOAA 1991-2020 Climate Normals, the city records an annual mean wind speed of about 12.4 mph, among the highest in the nation. The geography plays a big role. In spring, passing cyclones and sharp dryline boundaries create strong vertical mixing that pulls high-level momentum down to the surface. These patterns produce sudden gusts—the airport has recorded extreme gusts up to 90 mph during storm events—that are a regular part of daily weather. The city is windier between January and June, with April being the windiest month.
Casper, Wyoming

Casper earns its reputation as one of the windiest spots in the United States with an annual average of 12.7 mph. The city’s location at the foot of Casper Mountain and along the North Platte River Valley puts it in the path of strong pressure systems that sweep across the High Plains. Air is funneled through mountain gaps, speeding up as it drops into the valley. Late October to early April is when locals brace for the strongest stretches of wind, with January notorious for relentless gusts averaging 15 mph. On top of everyday breezes, the city also sees dramatic downslope windstorms, when warm Chinook winds roar down the eastern slopes, sometimes hitting hurricane-force speeds.
Oklahoma City, Oklahoma

Long-term data from NOAA’s NCEI Climate Normals (1991-2020) show Oklahoma City averaging around 12.8 mph sustained wind speed, placing it among the windiest major U.S. cities. The city sits in the Southern Plains near the dryline corridor, where humid Gulf air meets drier High Plains air. This geography encourages frequent storm systems, especially in spring. Spring is the peak windy season, driven by strong storm development. Summers bring steady southerly flow from the Gulf, while autumn often has sharp north winds after cold fronts.
Cheyenne, Wyoming

Cheyenne is one of the windiest cities in the country. Long-term data from NOAA’s 1991-2020 Climate Normals show average wind speeds at 14.6 mph, with frequent days above 30 mph. At nearly 6,000 feet on the High Plains, the city sits right where the Laramie Range opens into a natural gap, which funnels and accelerates winds. Strong pressure gradients in winter and early spring drive frequent high wind events. Summer brings a different challenge, with thunderstorms producing sudden outflow winds. Blizzards add another layer, creating whiteout conditions with gusts often above 70 mph.
Great Falls, Montana

Wind is a year-round feature in Great Falls. Based on NOAA’s 1991-2020 Climate Normals, the city records an annual mean wind speed close to 12.5 mph, which places it among the windiest in the United States. The location explains much of this pattern. Sitting just east of the Rocky Mountain Front along the Missouri River breaks, Great Falls is exposed to chinook winds that rush downslope from the Rockies. January is the windiest, with frequent gusts reaching 12 mph. April to October tend to be calmer, with August being the calmest month.
Fargo, North Dakota

Fargo ranks among the windiest cities in the United States based on data from NOAA’s National Centers for Environmental Information (NCEI) using the 1991-2020 climate normals. The primary reporting station is Hector International Airport (KFAR). Long-term records show an annual mean wind speed of a little over 12.4 mph, which is high compared with most U.S. cities. The geography of the Red River Valley explains much of this pattern. The land is extremely flat with few trees or hills to slow down airflow. This low surface roughness lets winds move across the plains with little resistance. Winds peak from September to June, with March being the windiest month.
Buffalo, New York

According to NOAA’s 1991-2020 Climate Normals, Buffalo averages about 11.7 mph sustained winds, ranking among the windiest major U.S. cities. Buffalo’s location on the eastern shore of Lake Erie explains much of its wind. Pressure differences across the lake create strong gradients, while coastal convergence channels wind into the city. Large-scale storm systems crossing the Great Lakes often intensify local gusts. Seasonally, Buffalo is windier from November to March, with January being the windiest. Summer winds are calmer, often shaped by localized lake breezes.
Boston, Massachusetts

Although Boston’s annual mean wind speed is approximately 12.3 mph, the city reported gusts of 90 mph during a bomb cyclone in October 2019. The city’s location on the Atlantic coastline and its harbor peninsulas make it especially exposed. Prevailing winds are often from the northeast or southwest, depending on season. Boston’s strongest winds occur in the cool season, with February being the windiest month. Cyclones bring frequent gusts above 40 mph. In summer, local sea-breeze circulations develop on warm afternoons, producing steady but lighter winds from the ocean.
Corpus Christi, Texas

The official station, Corpus Christi International Airport (KCRP), reports an annual average wind speed of 12.3 mph. These steady winds are tied to its Gulf Coast geography. The city sits on Corpus Christi Bay, where persistent onshore flow from the Gulf combines with a strong sea-breeze circulation. Inland heating also builds a pressure gradient that keeps air moving toward the coast. Seasonal patterns are consistent. From October to July, wind speeds average a little over 10.8 mph, but by April, they average at approximately 12.3 mph. July to October are the calmest times of the year.
More Than Just a Breezy Day
When scientists say a city is “windy,” they mean long-term average sustained wind speeds, not just storm days. This ranking uses NOAA’s 1991-2020 Climate Normals, cross-checked with Weather Spark, online research, and state climatologists. Data comes from airport weather stations, measuring annual averages, seasonal highs and lows, calm periods, and extreme gusts. Wind patterns vary by geography, but these cities consistently rank among the nation’s windiest.