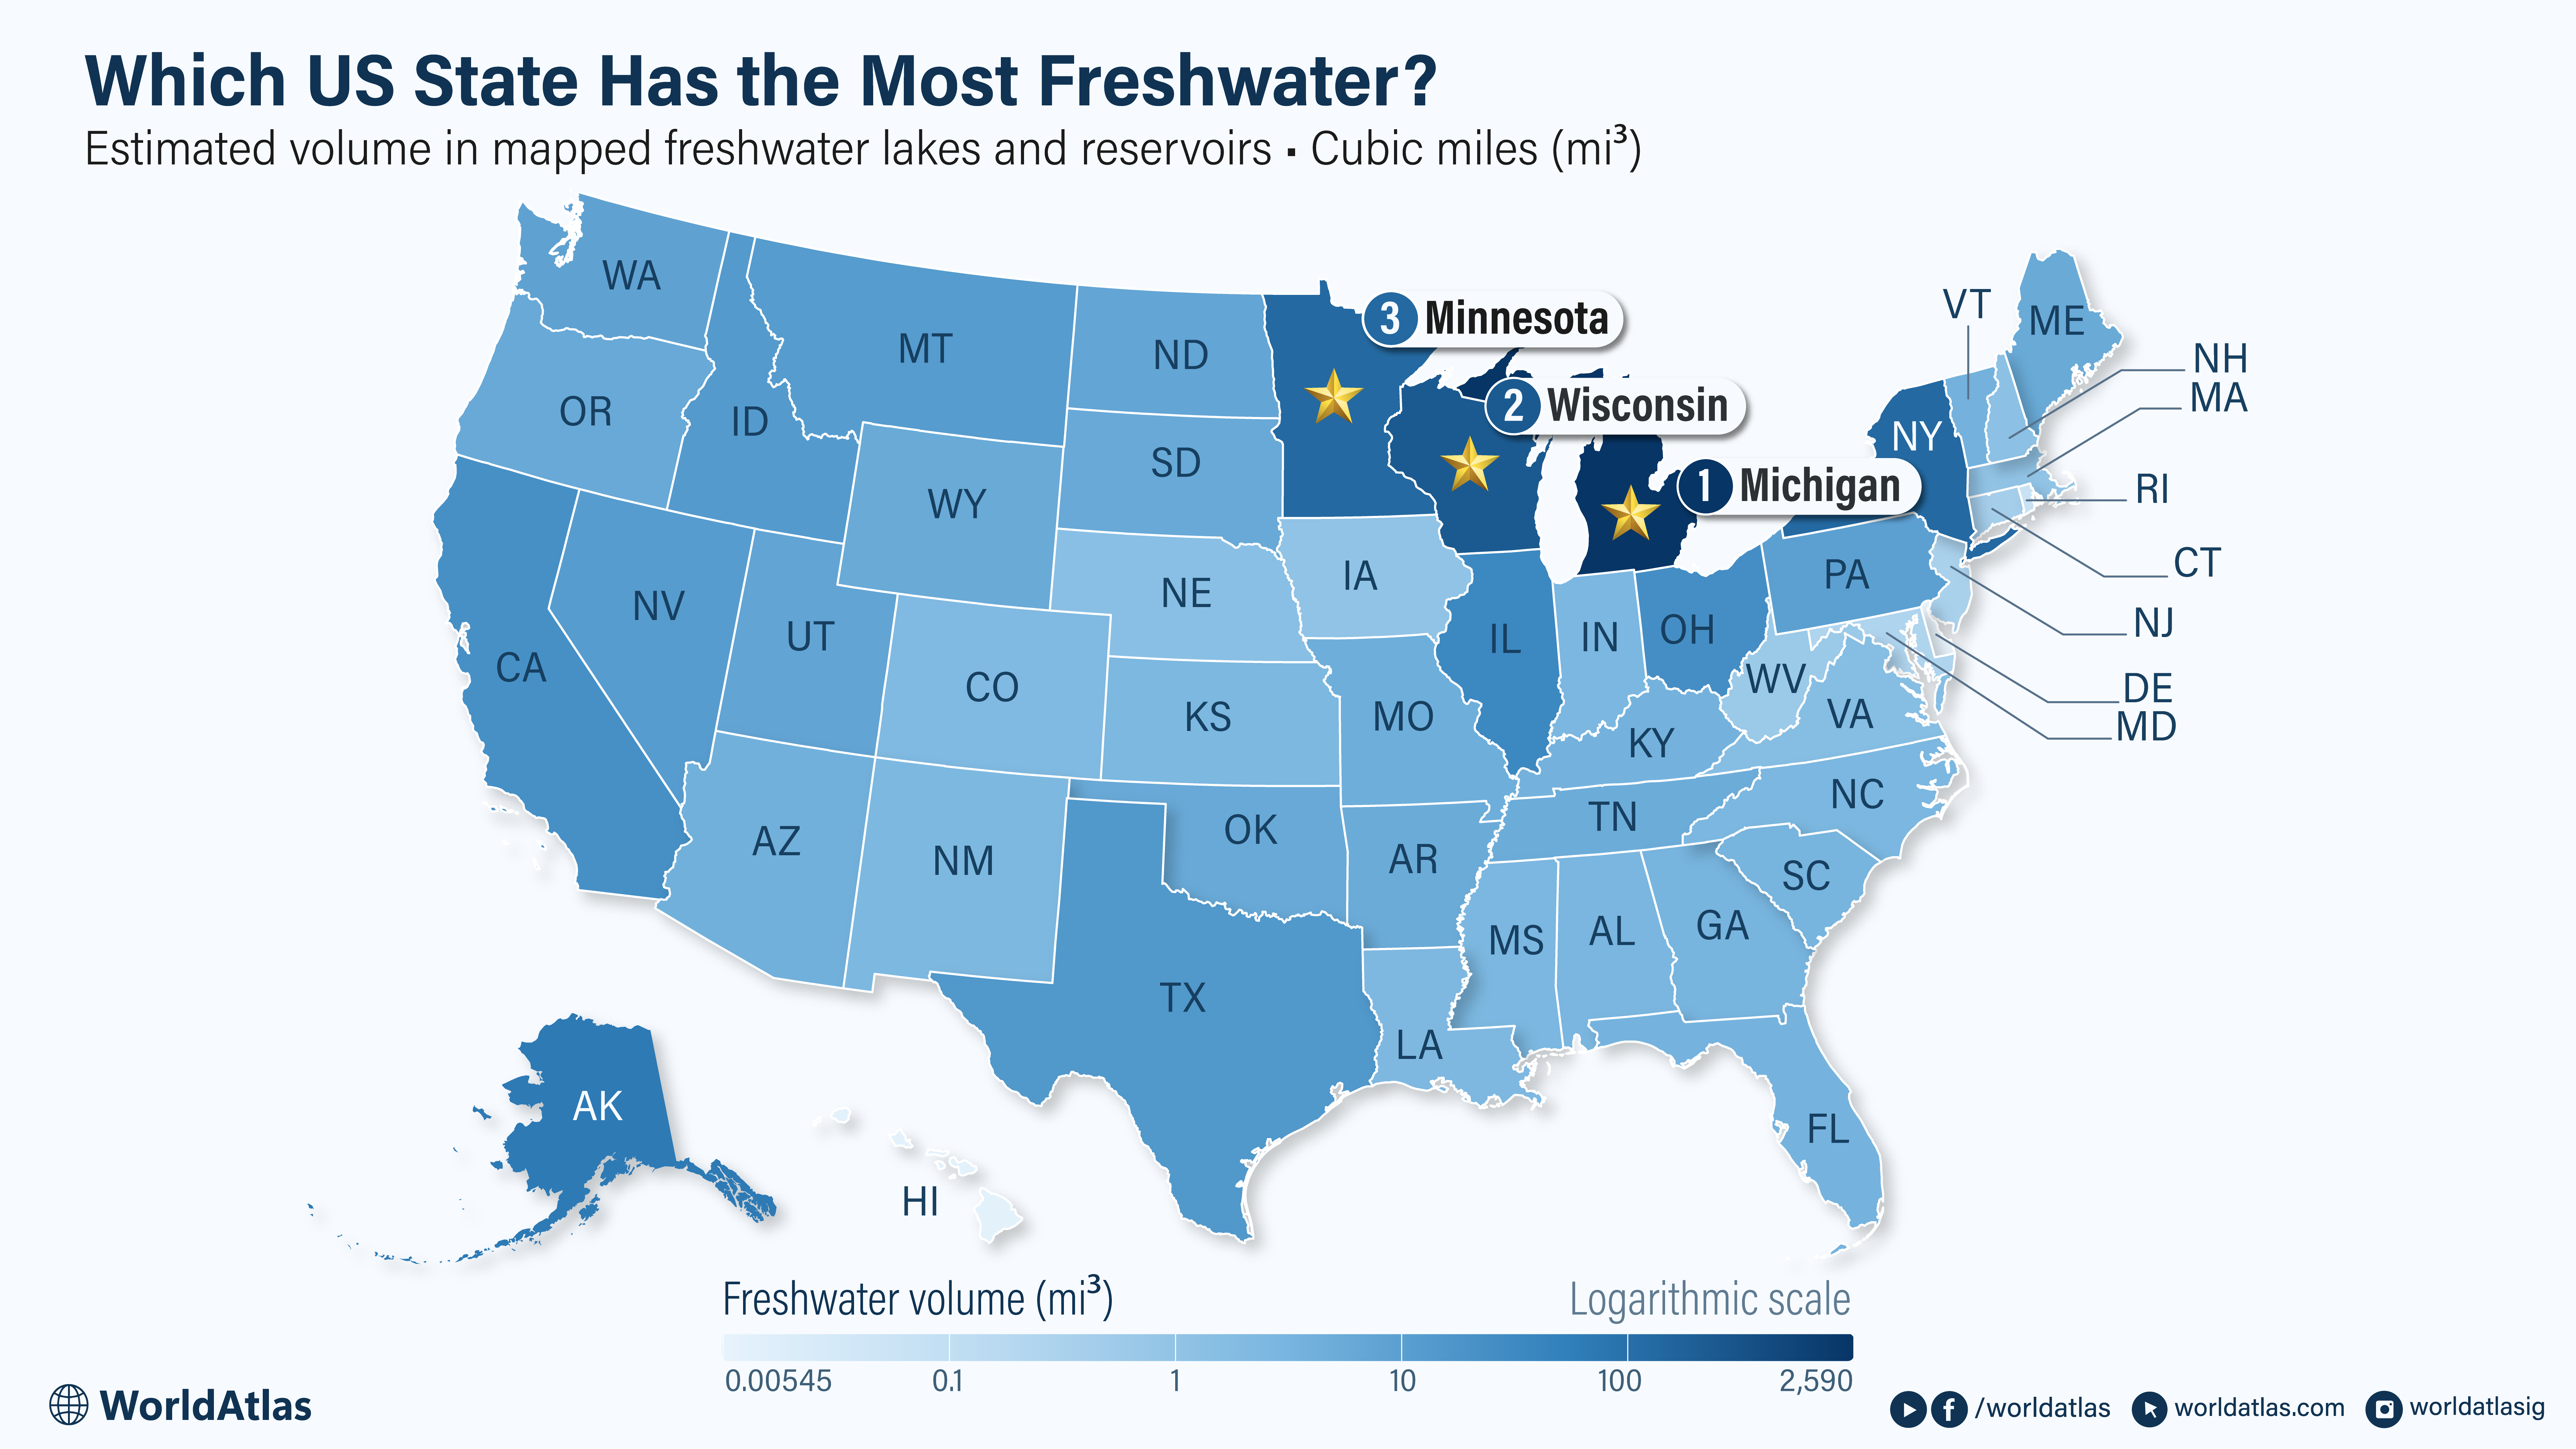
Which US State Has The Most Fresh Water?
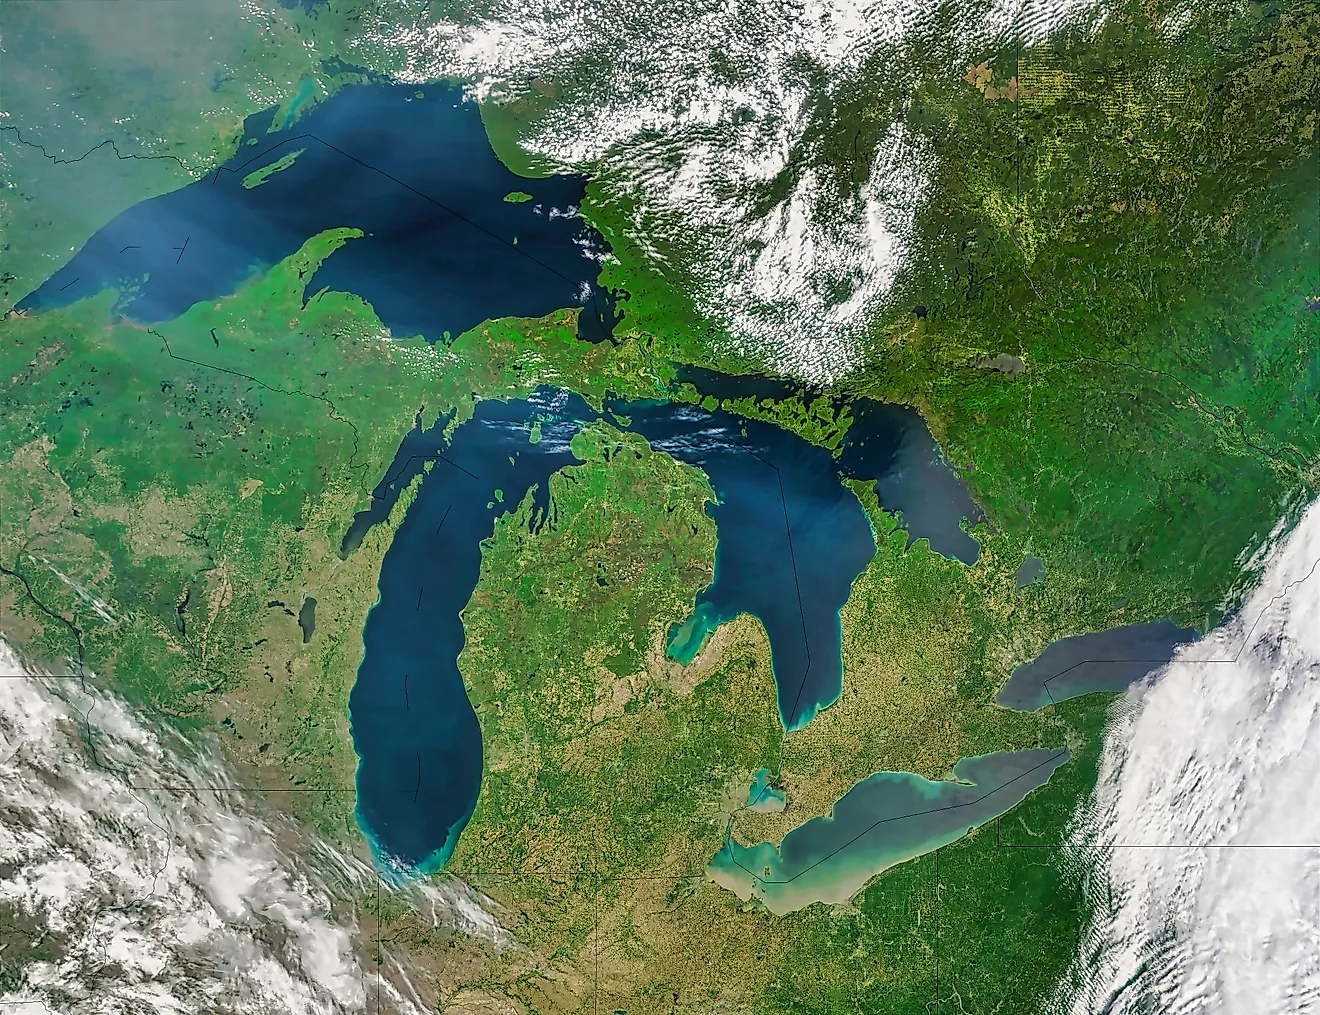
Lakes and reservoirs hold most of the surface freshwater in the United States, and it is spread very unevenly across the map. A few northern states store enormous volumes while much of the country gets by on a tiny share. Michigan holds the most of any state, roughly 2,590 mi3, because its boundaries extend deep into several Great Lakes basins. Depth is why a smaller lake can hold more water than a wide, shallow one, and it drives the entire ranking below.
The figures come from the HydroLAKES dataset, with Great Lakes volumes split between states using NOAA depth data and Canadian waters left out. They count only freshwater lakes and reservoirs of at least about 25 acres, so rivers, groundwater, glacial ice, and salt water are not included.
The ranking is more lopsided than the question lets on. Michigan alone holds more freshwater than the other forty-nine states combined, and the four Great Lakes states at the top hold almost nine-tenths of the national total. Size and rainfall barely predict the rest of the order. Texas, the second-largest state, ranks ninth, and wetland-rich Florida sits near the middle, because the ranking turns on deep lakes rather than marshes, rivers, or sheer acreage. The sections below cover the states leading the list, and the full table at the end ranks all fifty.
Michigan

Four Great Lakes reach Michigan's shores: Superior, Michigan, Huron, and Erie. The state's underwater boundaries extend well beyond its beaches, enclosing large portions of several deep basins. Its estimated share of Lake Superior alone contains roughly 1,570 mi3. Lake Michigan contributes another 688 mi3, and Lake Huron adds about 327 mi3.
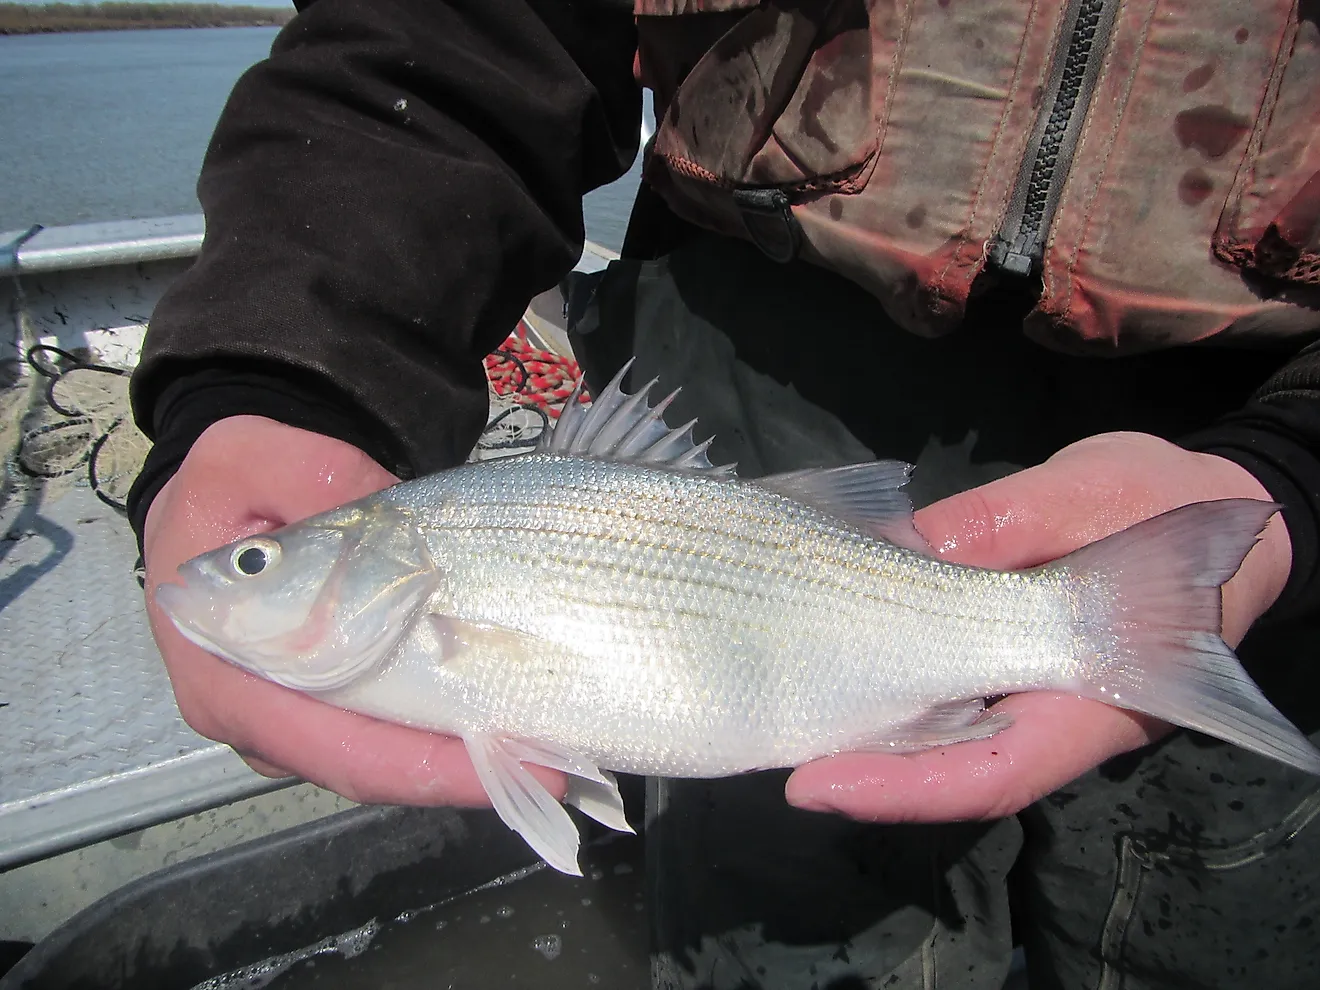
For lake trout, the depth is useful habitat. As nearshore water warms during summer, the fish follow colder temperatures into water 100 to 200 feet deep, sometimes deeper. Anglers encounter the same species inland in lakes such as Higgins, Torch, and Crystal. In fall, lake trout spawn on shoals and reefs, depositing their eggs among cobble and gravel on the lake bottom.
Wisconsin

Wisconsin holds about 507 mi3 of freshwater lake and reservoir volume, most of it in its two Great Lakes. The larger share lies to the east, in Lake Michigan. The estimated Wisconsin portion of that lake holds about 422 mi3, compared with about 81.5 mi3 in its part of Lake Superior. Lake Michigan's large contribution explains why Wisconsin ranks second even though Superior is the larger and deeper lake overall.
On Superior, the Apostle Islands and the Western Arm support some of the lake's most productive fisheries. Lake trout are major predators and a favored catch. Nearshore Chequamegon Bay supports both cold-water and cool-water fish, while the Bois Brule River provides spawning runs of trout and salmon.
Minnesota

Along Minnesota's North Shore, trout can remain nearer shore and higher in the water column during winter and spring, when those waters are cold. Lake Superior can retain open water in winter, allowing boat fishing when weather and access permit. Near Duluth, runoff produces cloudy plumes, and anglers look for trout and salmon along their edges.
The state's estimated portion of Superior holds roughly 248 mi3 of freshwater, more than nine-tenths of Minnesota's lake and reservoir total. Inland lakes add water across the state, including Red Lake and Mille Lacs, while Lake of the Woods and Rainy Lake extend across the Canadian border.
New York

New York's freshwater total is dominated by its portion of Lake Ontario, with a smaller contribution from Lake Erie. Farther inland, the Finger Lakes demonstrate how much depth changes a lake's volume. Seneca Lake contains about 3.72 mi3 of water, and Cayuga holds about 2.25 mi3. Seneca's volume is roughly 400 times that of nearby Honeoye Lake.
Ten of the eleven Finger Lakes serve as public drinking-water sources, collectively supplying about 1.5 million customers. Most also support both cold-water trout and warm-water bass fisheries. Their basins drain through river systems that eventually reach Lake Ontario.
Alaska

Alaska is the highest-ranking state in this estimate without a share of the Great Lakes. Its large natural lakes include Iliamna, Becharof, and Naknek. Iliamna alone holds an estimated 27.7 mi3, exceeding the estimated lake-and-reservoir total of most states.
Southwestern Alaska's lakes also form connected habitat for sockeye salmon. Water leaves Lake Clark through the Newhalen River and enters Iliamna Lake before continuing toward Bristol Bay. The National Park Service protects part of this watershed to sustain the salmon fishery. Spawning fish bring nutrients into the surrounding ecosystem, and bears and wolves travel riverbanks and lakeshores in search of them.
A lake's water renewal depends on both its volume and its average outflow. Retention time expresses that relationship by dividing stored volume by the amount flowing out each year. Lake Superior's estimated retention time is about 191 years; Lake Erie's is about 2.6 years. The contrast accompanies a large difference in depth: Superior averages 483 feet, while Erie averages 62 feet. Erie warms rapidly in spring and summer. Its productive waters support fisheries and supply drinking water to millions of people, but excess nutrients encourage algal blooms. When large quantities of algae die and decompose, they can deplete dissolved oxygen in the lake water.
Estimated Freshwater Volume in Mapped Lakes and Reservoirs by State
| Rank | State | Estimated freshwater volume (mi3) |
|---|---|---|
| 1 | Michigan | 2,590 |
| 2 | Wisconsin | 507 |
| 3 | Minnesota | 264 |
| 4 | New York | 257 |
| 5 | Alaska | 125 |
| 6 | Illinois | 56.1 |
| 7 | Ohio | 38.8 |
| 8 | California | 35.9 |
| 9 | Texas | 22.2 |
| 10 | Idaho | 19.6 |
| 11 | Montana | 17.3 |
| 12 | Nevada | 16.6 |
| 13 | Pennsylvania | 13.2 |
| 14 | Washington | 11.8 |
| 15 | Utah | 10.2 |
| 16 | North Dakota | 9.66 |
| 17 | Oklahoma | 7.84 |
| 18 | South Dakota | 7.84 |
| 19 | Oregon | 7.66 |
| 20 | Maine | 7.50 |
| 21 | Wyoming | 7.49 |
| 22 | Arkansas | 6.90 |
| 23 | Tennessee | 6.42 |
| 24 | Missouri | 5.85 |
| 25 | Arizona | 5.21 |
| 26 | Kentucky | 4.60 |
| 27 | Vermont | 4.50 |
| 28 | Florida | 4.27 |
| 29 | Georgia | 3.97 |
| 30 | South Carolina | 3.95 |
| 31 | Alabama | 3.47 |
| 32 | Mississippi | 3.23 |
| 33 | Indiana | 3.21 |
| 34 | North Carolina | 3.17 |
| 35 | Kansas | 2.99 |
| 36 | New Mexico | 2.84 |
| 37 | Louisiana | 2.75 |
| 38 | Colorado | 2.50 |
| 39 | Virginia | 1.86 |
| 40 | Nebraska | 1.55 |
| 41 | New Hampshire | 1.35 |
| 42 | Iowa | 1.09 |
| 43 | Massachusetts | 0.996 |
| 44 | West Virginia | 0.624 |
| 45 | Connecticut | 0.373 |
| 46 | New Jersey | 0.298 |
| 47 | Maryland | 0.228 |
| 48 | Rhode Island | 0.0458 |
| 49 | Hawaii | 0.00697 |
| 50 | Delaware | 0.00545 |