Big Mac Index By Country
The Big Mac Index is a metric that compares the prices of Big Macs across countries with those in the United States. Developed by The Economist Magazine in 1986 as a tool to compare purchasing power parity (PPP), the index has become a prominent indicator in the global economy and currency valuation.
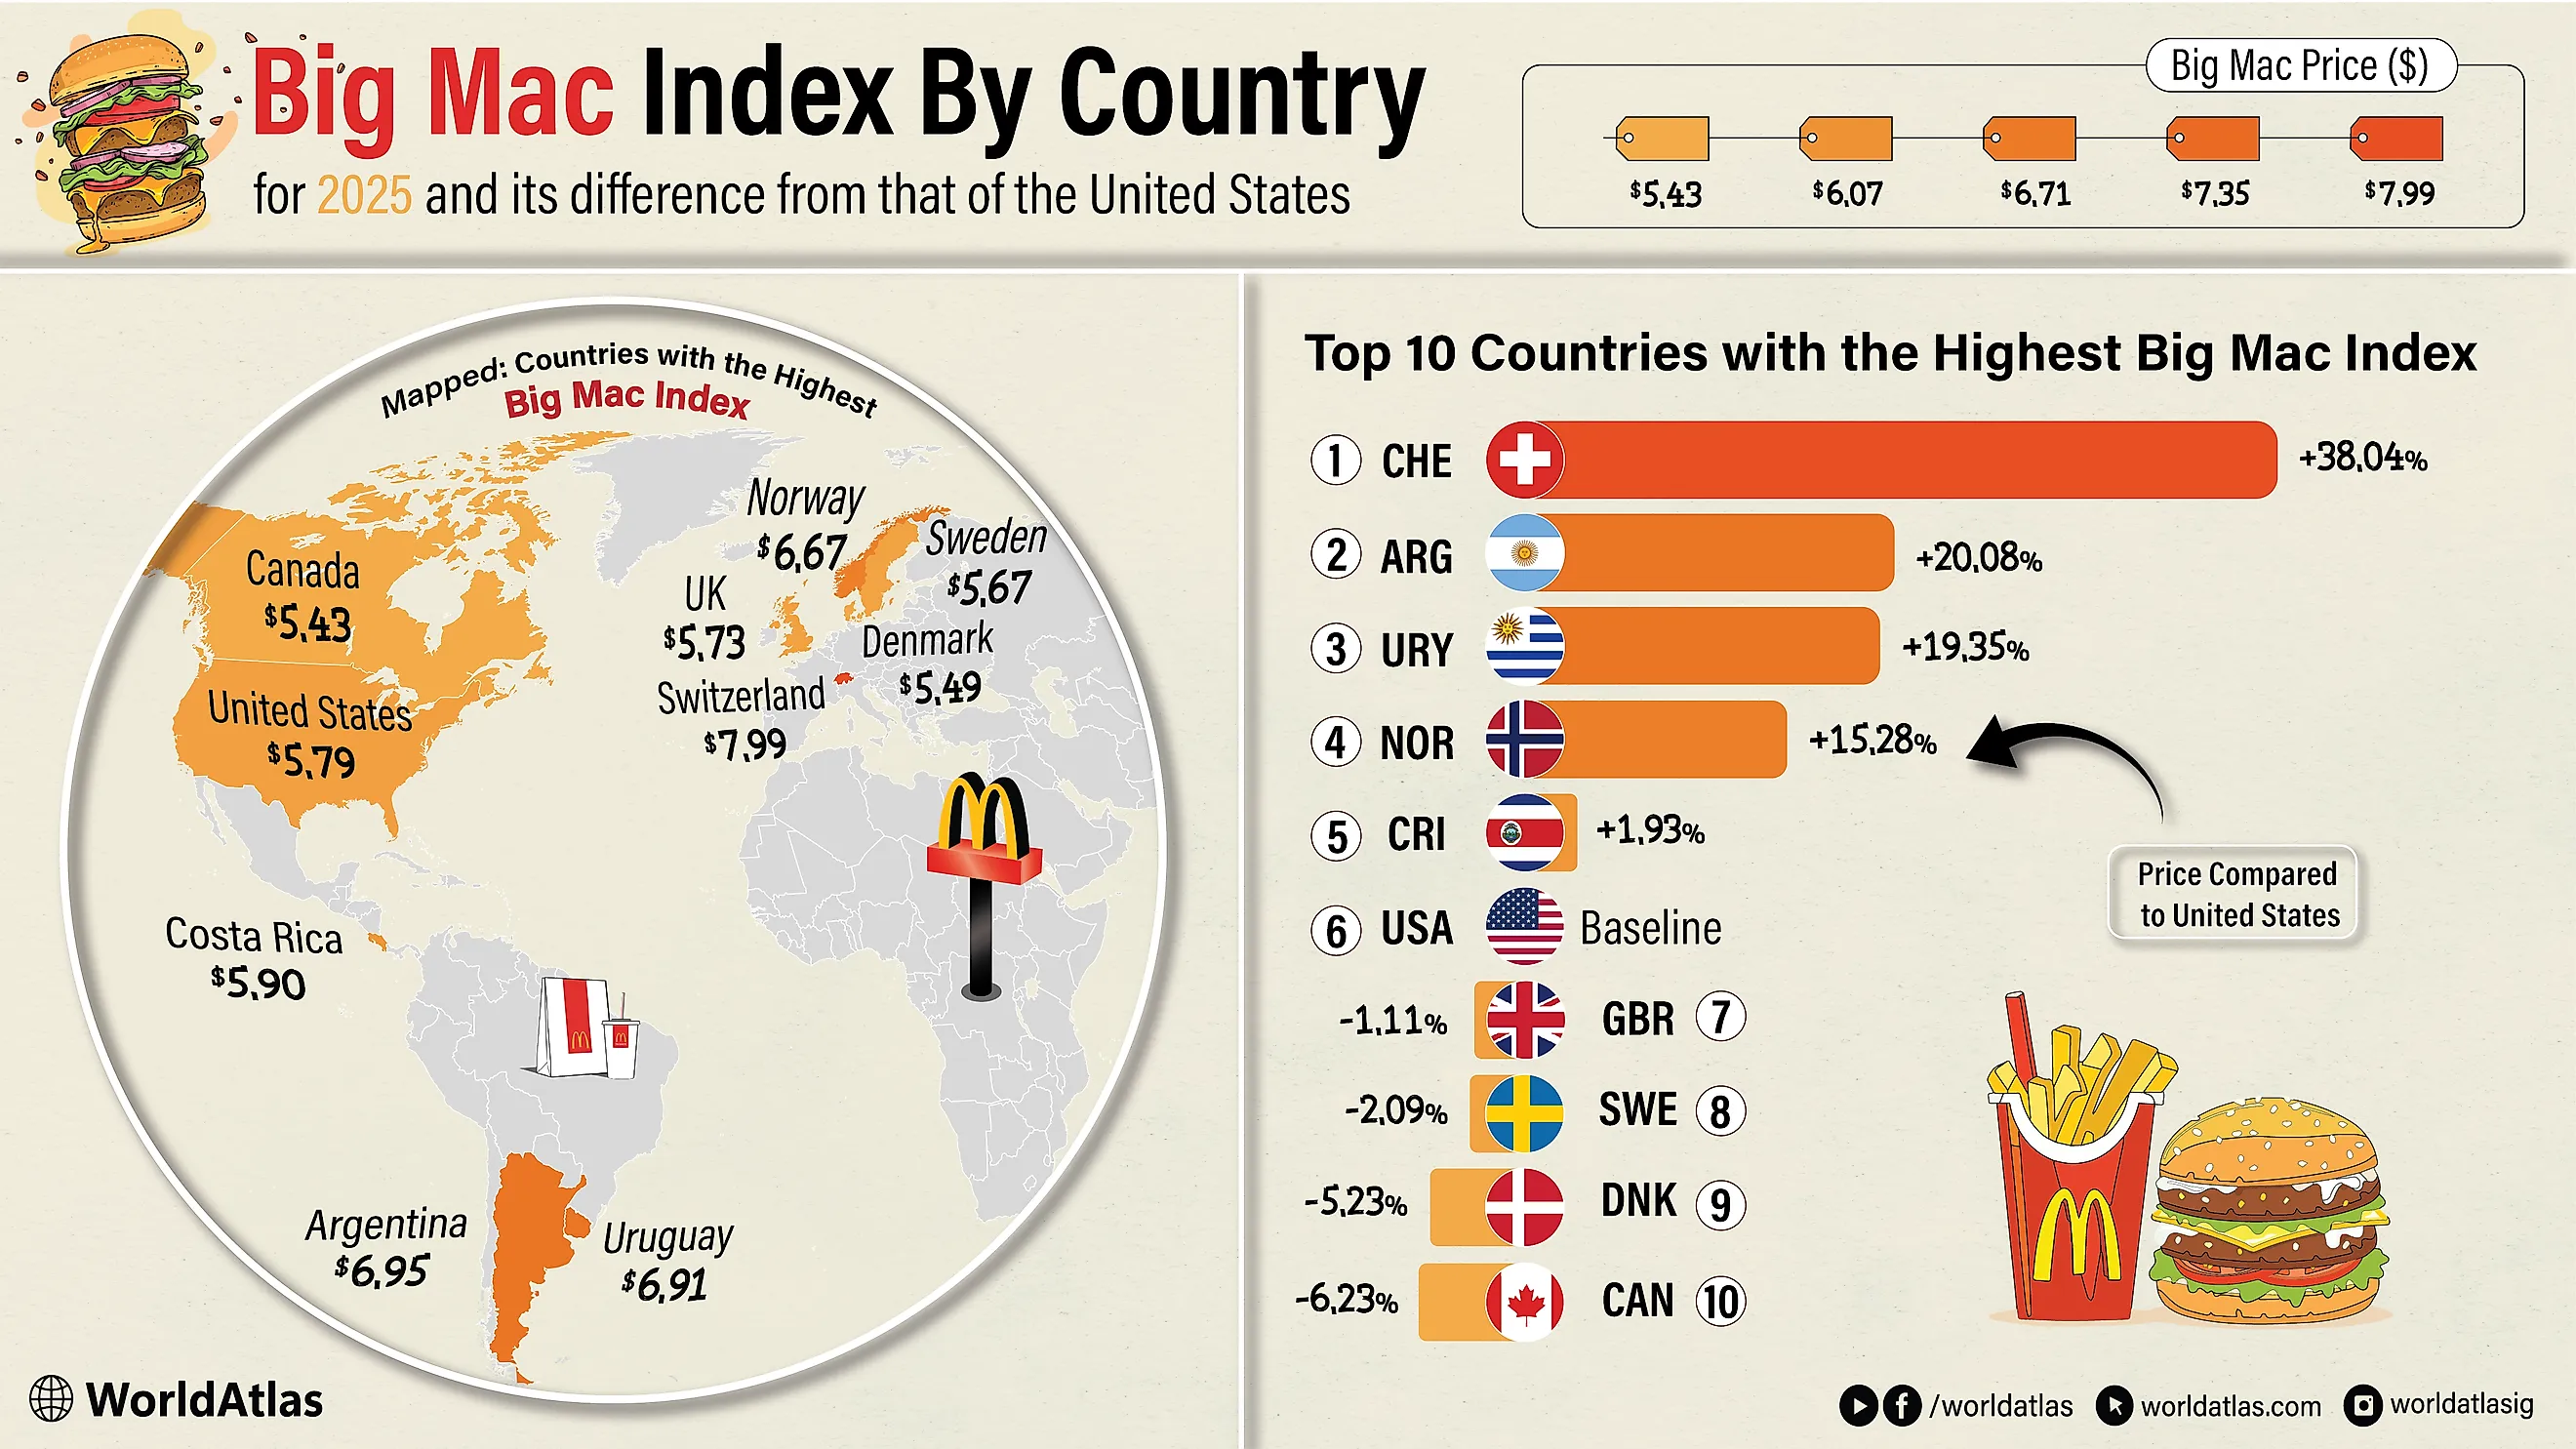
As of 2026, the baseline Big Mac in the United States costs about $5.79. Only a small number of countries record higher prices. Switzerland tops the index with a Big Mac priced at $7.99, followed by Argentina, Uruguay, Norway, and Costa Rica. Other countries rounding out the top ten include the United Kingdom, Sweden, Denmark, and Canada, all of which post Big Mac prices above or close to the U.S. benchmark. This article delves into the top ten countries on the Big Mac Index.
Top 10 Countries With The Highest Big Mac Index
| Rank | Country | Big Mac Price (USD) | % Difference vs USA |
|---|---|---|---|
| 1 | Switzerland | $7.99 | +38.04% |
| 2 | Argentina | $6.95 | +20.08% |
| 3 | Uruguay | $6.91 | +19.35% |
| 4 | Norway | $6.67 | +15.28% |
| 5 | Costa Rica | $5.90 | +1.93% |
| 6 | United States | $5.79 | 0.00% (Baseline) |
| 7 | United Kingdom | $5.73 | −1.11% |
| 8 | Sweden | $5.67 | −2.09% |
| 9 | Denmark | $5.49 | −5.23% |
| 10 | Canada | $5.43 | −6.23% |
1. Switzerland — $7.99 (38.04%)

Switzerland tops the Big Mac Index as of 2026, with a Big Mac costing $7.99. This is the most expensive Big Mac in the world, priced more than $1 above second-place Argentina. It is also 38.04% higher than the United States price of $5.79, highlighting the country’s strong economy and high purchasing power. Along with a strong economy, Switzerland has some of the highest wages in the world, and a GDP per capita of $103,998.2 as of 2024. This significantly increases labor costs for entry-level service workers and directly affects fast-food pricing. In addition, Switzerland enforces strict food quality, sourcing, and agricultural standards, which raise production costs.
High commercial rents, especially in cities like Zurich and Geneva, also contribute to elevated operating costs for restaurants. As a result, everyday consumer goods, including fast food, tend to be far more expensive than in neighboring European countries. For these reasons, Switzerland consistently ranks at or near the top of the Big Mac Index and has held this position for multiple years.
2. Argentina — $6.95 (20.08%)

Argentina ranks second on the Big Mac Index in 2026, with a Big Mac priced at $6.95, about 20.08% higher than the United States benchmark of $5.79. This makes it the most expensive Big Mac in Latin America and more costly than in many major U.S. cities, including New York. The high price is largely driven by Argentina’s currency and economic conditions rather than high wages. In recent years, a stronger official peso exchange rate, combined with capital controls and inflation, has pushed local prices higher when converted into U.S. dollars. As a result, the Big Mac Index for Argentina has swung sharply over time, shifting from deep undervaluation in many previous years to significant overvaluation in 2026.
Despite a GDP per capita of about $13,969.8 in 2024, everyday goods like fast food remain expensive in dollar terms. These price distortions reflect broader economic instability, making Argentina one of the most volatile countries on the Big Mac Index over the past two decades.
3. Uruguay — $6.91 (19.35%)

Uruguay ranks just behind Argentina on the Big Mac Index in 2026, with a Big Mac priced at $6.91, around 19.35% higher than the U.S. benchmark of $5.79. Despite having a far smaller economy than many countries on this list, Uruguay consistently posts high prices due to a combination of currency valuation, taxation, and structural costs. The Uruguayan peso is frequently considered overvalued in purchasing power terms, which inflates local prices when converted into U.S. dollars.
Labor costs also play a role. Uruguay has comparatively high minimum wages and strong labor protections relative to much of Latin America, raising operating expenses for service-sector businesses such as fast-food restaurants. Additionally, Uruguay imposes higher consumption taxes and import duties, increasing the cost of inputs used in food production and retail. With a GDP per capita of roughly $23,906.5 in 2024, Uruguay’s Big Mac price highlights how stable currencies and regulated economies can produce high consumer prices even without extreme wage levels.
4. Norway — $6.67 (15.28%)

Norway ranks among the most expensive countries on the Big Mac Index in 2026, with a Big Mac priced at about $6.67. This places it 15.28% above the U.S. benchmark of $5.79 and consistently near the top of the global rankings. Norway’s high labor costs mainly drive the high price. Wages in the service sector are among the highest in the world, which directly raises fast food prices.
Taxes also play a major role. Norway applies high-value-added taxes and strict regulations on food production and sales, thereby increasing restaurants' operating costs. Strong purchasing power further supports these higher prices, as consumers can afford more expensive everyday goods. As a result, the Norwegian krone often appears overvalued against the U.S. dollar in the Big Mac Index. Regional differences exist within the country. Prices in Oslo and other large cities are typically higher than in smaller towns. With a GDP per capita of about $86,785.4 in 2024, Norway’s Big Mac price reflects its overall high cost of living rather than economic instability.
5. Costa Rica — $5.90 (1.93%)

Costa Rica is the third country in Latin America in the top ten of the Big Mac Index, with a Big Mac price just over that of the United States. The cost of a Big Mac in Costa Rica is $5.90, which is 1.93% higher than the U.S. benchmark of $5.79. The increased price is due to a variety of reasons, most of which are shared with other countries in the region. These include a mildly overvalued currency in PPP terms, high labor costs in the region, and reliance on imported raw materials such as beef.
Costa Rica has a GDP per capita of roughly $18,587.2 as of 2024, placing it above most Central American economies. The country applies a 13% value-added tax, which raises food and restaurant prices. By comparison, a Big Mac in Mexico typically costs well under $5.00, highlighting how Costa Rica’s higher wages, taxes, and reliance on imports make fast food significantly more expensive than in neighboring Latin American economies.
6. United States — $5.79 (Baseline)

The United States serves as the baseline country for the Big Mac Index. In 2026, a Big Mac in the U.S. costs about $5.79, up from $5.69 in 2024 and $5.15 in 2023, reflecting steady price increases over time. As of January 2026, some estimates place the average price closer to $6, showing continued inflation in food and labor costs. Because the index is measured against U.S. prices, other countries are evaluated based on whether their currencies appear overvalued or undervalued relative to the U.S. dollar.
The rising local price is primarily due to food inflation, higher fast-food wages, and rising input costs. Overall, food prices continue to rise, leading to higher costs for fast-food items like Big Macs. Moreover, the costs of beef, cheese, and bread in the U.S. have risen steadily since 2021, making fast food more expensive to produce.
7. United Kingdom — $5.73 (-1.11%)

The United Kingdom follows closely behind the United States on the Big Mac Index, with an average Big Mac price of $5.73 in 2026, about 1.11% lower than the U.S. benchmark. Prices tend to be higher in London and the South East, where rents and wages are significantly above the national average, while in smaller cities and towns, menu prices are often slightly lower.
The UK’s GDP per capita stood at approximately $53,246.4 in 2024, well below that of the United States, yet Big Mac prices remain comparable due to higher operating costs. Labor expenses have risen steadily following increases in the national minimum wage, which reached £12.21 per hour in 2026 for workers aged twenty-one and over. Value-added tax, set at 20%, also contributes to higher food and restaurant prices. Although the British pound often appears slightly overvalued against the U.S. dollar in PPP terms, the UK’s Big Mac price reflects a balance between strong consumer demand, high urban costs, and relatively stable currency conditions rather than extreme inflation.
8. Sweden — $5.67 (-2.09%)

Also in Europe, Sweden is another country with slightly cheaper Big Mac prices than the United States. A Big Mac here costs approximately $5.67, which is 2.09% cheaper than the baseline of $5.79, and eighth on the Big Mac Index as of 2024. According to the World Bank, Sweden's GDP per capita was $57,117.5 in 2024, indicating a strong economy. While the country does not have a statutory minimum wage like the United Kingdom, salaries in the fast-food industry are high, approaching UK levels. Moreover, with burgers in major cities like Malmö costing much more, the index does a great job of showcasing the country’s purchasing power, which is considered just short of that in the United States.
9. Denmark — $5.49 (-5.23%)

Denmark ranks ninth on the Big Mac Index in 2026, with a Big Mac priced at $5.49. This is about 5.23% cheaper than the U.S. benchmark. Even so, Denmark remains one of the most expensive countries in the world overall. The slightly lower price mainly reflects currency valuation rather than low costs.
Labor in Denmark is expensive, even though there is no official minimum wage. Fast-food wages are set through union agreements and are among the highest globally. On top of this, Denmark has a 25% value-added tax, one of the highest VAT rates in the world. These factors usually push prices up. However, strong purchasing power helps balance things out. With a GDP per capita of about $71,026.5 in 2024, consumers can absorb higher everyday costs. Denmark’s Big Mac price shows that high wages and taxes can still leave prices close to the U.S. level.
10. Canada — $5.43 (-6.23%)

Canada rounds out the top ten on the Big Mac Index in 2026, with a Big Mac priced at $5.43. This is roughly 6.23% cheaper than the U.S. price. Costs vary across the country, with higher prices in cities like Toronto and Vancouver and lower prices in smaller provinces.
The slightly lower price is mostly tied to the Canadian dollar rather than cheaper production. Labor costs have risen in recent years, as many provinces have raised minimum wages to between CAD 15 and 17 per hour. Sales taxes also add to the final price, ranging from 5% to 15% depending on the province. Canada’s GDP per capita was around $54,340.3 in 2024. Also, based on purchasing power parity (PPP), the Canadian dollar is considered slightly undervalued compared to the U.S. dollar. This means the exchange rate plays a role in keeping the Big Mac cheaper for Americans buying it in Canada, rather than the burger itself being significantly less expensive to produce.
Top Countries According To The Big Mac Index
The Big Mac Index compares the price of the same McDonald’s Big Mac across countries to show differences in the cost of living and currency value. Created by The Economist in 1986, it offers a simple way to understand purchasing power parity. By comparing the cost of a Big Mac in the United States to other countries, the index highlights wage levels, taxes, and everyday expenses. This list shows the ten countries where Big Macs are most expensive in 2026.
Countries Ranked By Big Mac Index
| Rank | Country | Big Mac Index (Price) | % Difference vs USA |
|---|---|---|---|
| 1 | Switzerland | $7.99 | 38.04% |
| 2 | Argentina | $6.95 | 20.08% |
| 3 | Uruguay | $6.91 | 19.35% |
| 4 | Norway | $6.67 | 15.28% |
| 5 | Costa Rica | $5.90 | 1.93% |
| 6 | United States | $5.79 | - |
| 7 | United Kingdom | $5.73 | -1.11% |
| 8 | Sweden | $5.67 | -2.09% |
| 9 | Denmark | $5.49 | -5.23% |
| 10 | Canada | $5.43 | -6.23% |
| 11 | Lebanon | $5.36 | -7.42% |
| 12 | Turkey | $5.32 | -8.18% |
| 13 | Poland | $5.21 | -10.01% |
| 14 | Colombia | $5.17 | -10.63% |
| 15 | Singapore | $5.17 | -10.72% |
| 16 | Saudi Arabia | $5.07 | -12.51% |
| 17 | United Arab Emirates | $4.90 | -15.36% |
| 18 | Australia | $4.87 | -15.88% |
| 19 | New Zealand | $4.77 | -17.55% |
| 20 | Israel | $4.71 | -18.57% |
| 21 | Mexico | $4.60 | -20.53% |
| 22 | Czechia | $4.56 | -21.21% |
| 23 | Chile | $4.55 | -21.45% |
| 24 | Kuwait | $4.54 | -21.52% |
| 25 | Peru | $4.53 | -21.78% |
| 26 | Bahrain | $4.51 | -22.12% |
| 27 | Nicaragua | $4.48 | -22.66% |
| 28 | Venezuela | $4.45 | -23.08% |
| 29 | Honduras | $4.12 | -28.78% |
| 30 | Qatar | $4.12 | -28.85% |
| 31 | Brazil | $4.03 | -30.47% |
| 32 | Thailand | $4.01 | -30.80% |
| 33 | Guatemala | $4.01 | -30.66% |
| 34 | Oman | $3.97 | -31.36% |
| 35 | South Korea | $3.84 | -33.63% |
| 36 | Pakistan | $3.77 | -34.97% |
| 37 | Azerbaijan | $3.67 | -36.61% |
| 38 | Hungary | $3.65 | -37.02% |
| 39 | Jordan | $3.53 | -39.10% |
| 40 | China | $3.52 | -39.24% |
| 41 | Moldova | $3.52 | -39.15% |
| 42 | Romania | $3.43 | -40.77% |
| 43 | Japan | $3.11 | -46.29% |
| 44 | Hong Kong | $3.08 | -46.77% |
| 45 | Vietnam | $3.03 | -47.66% |
| 46 | Malaysia | $3 | -48.13% |
| 47 | Philippines | $2.89 | -50.05% |
| 48 | Ukraine | $2.86 | -50.65% |
| 49 | South Africa | $2.78 | -52.04% |
| 50 | Egypt | $2.69 | -53.60% |
| 51 | India | $2.62 | -54.79% |
| 52 | Indonesia | $2.54 | -56.22% |
| 53 | Taiwan | $2.38 | -58.84% |