The Richest Countries In The World 2025
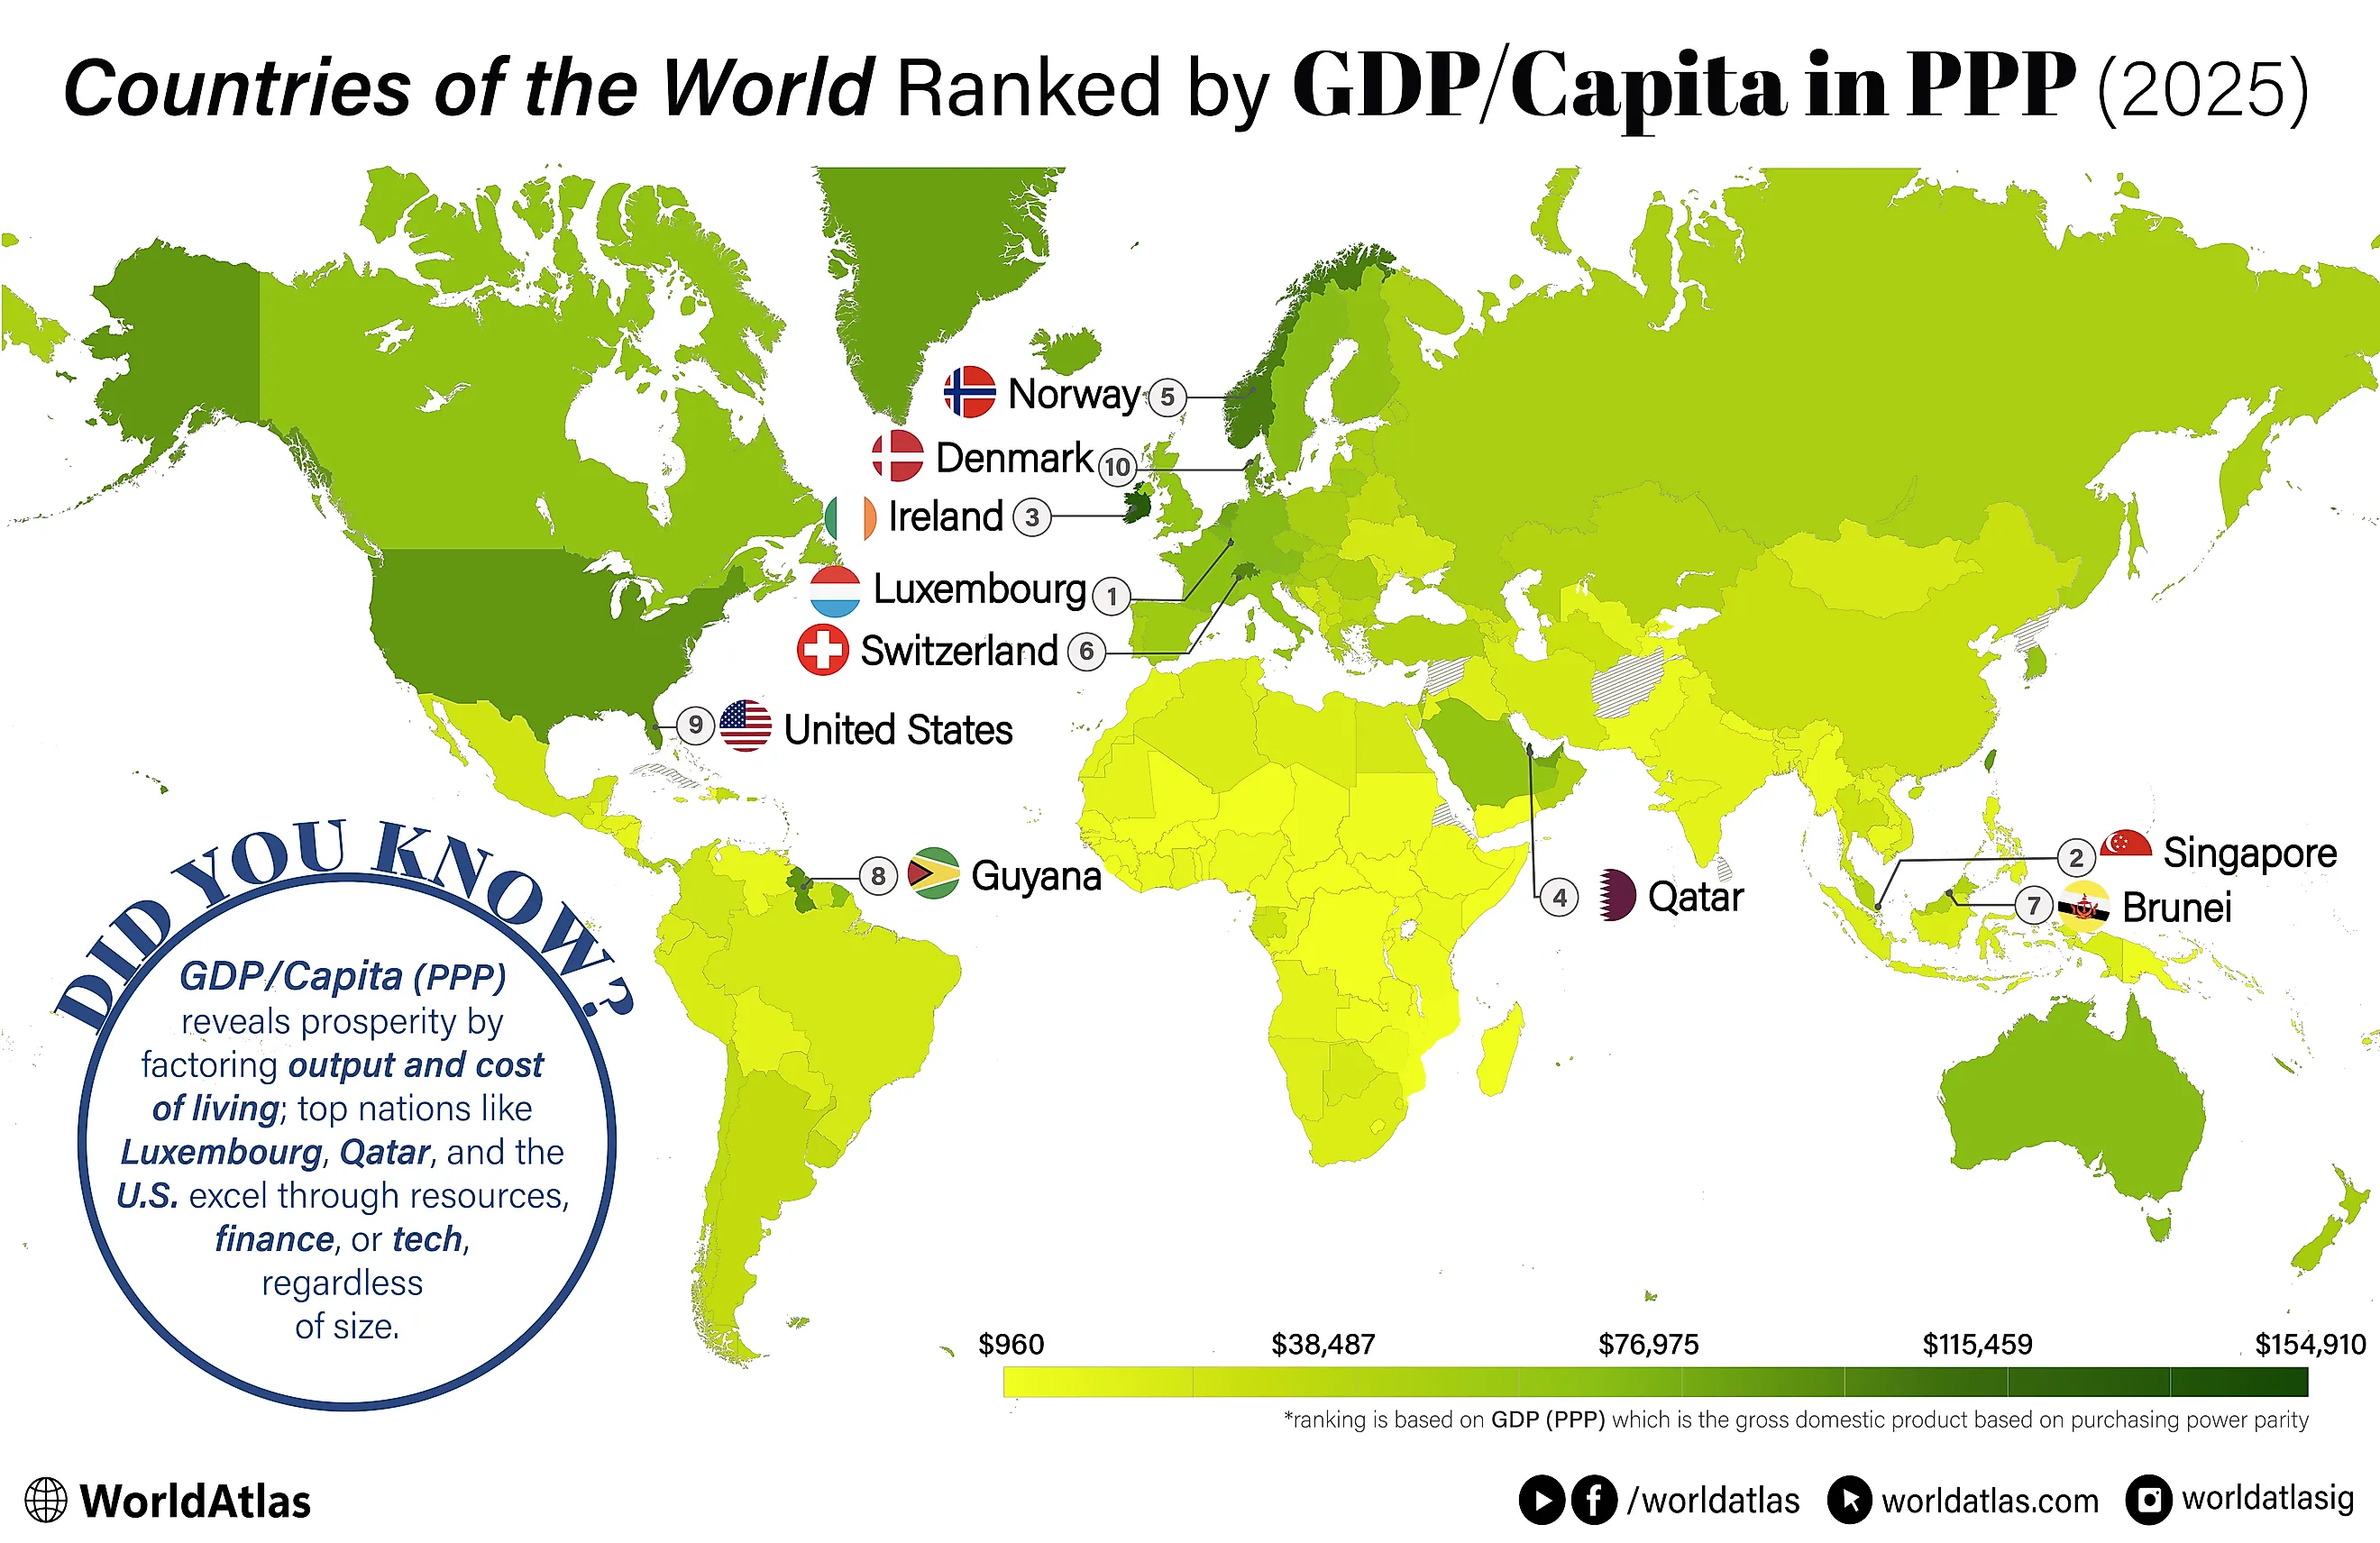
When measuring a nation’s prosperity, GDP per capita in purchasing power parity (PPP) often provides a nuanced view by accounting for both economic output and the relative cost of living. The "richest" countries on these lists can be surprisingly small in size or population, yet have highly specialized industries, robust financial sectors, or valuable natural resources. In many instances, these nations leverage their unique advantages, whether it’s Luxembourg’s potent finance and banking infrastructure or Qatar’s abundant petroleum reserves, to attain exceptionally high GDP per capita figures. Other significant examples include Singapore’s role as a global finance and trade hub and Norway’s strategic management of oil and gas revenues.
That said, larger economies with extensive diversification, like the United States, can also earn a spot among the highest earners per capita, thanks to their technological leadership, advanced service sectors, or globally impactful industries. Meanwhile, emerging producers such as Guyana highlight how recent resource discoveries can reshape an entire economic landscape in just a few years!
Below is a closer look at ten countries that top the global charts in GDP per capita (PPP) using data provided by the IMF for 2025. Liechtenstein stands out as the richest country for 2025, with GDP/Capita in PPP of $201,112. Singapore and Luxembourg come next at $156,969 and $152,395, respectively. Each entry below outlines the key factors, ranging from historical transformations and economic reforms to resource management and governmental policies, that have propelled these nations to their lofty positions on the world stage.
The 10 Richest Countries In The World
| Rank | Country | GDP/Capita (PPP) |
|---|---|---|
| 1 | Liechtenstein | $201,112 |
| 2 | Singapore | $156,969 |
| 3 | Luxembourg | $152,394 |
| 4 | Ireland | $147,878 |
| 5 | Qatar | $122,283 |
| 6 | Norway | $106,694 |
| 7 | Switzerland | $97,659 |
| 8 | Brunei Darussalam | $94,472 |
| 9 | Guyana | $94,189 |
| 10 | United States | $89,598 |
Jump to the list of all countries ranked by GDP/Capita (PPP)
1. Liechtenstein - $201,112 GDP/Capita (PPP)
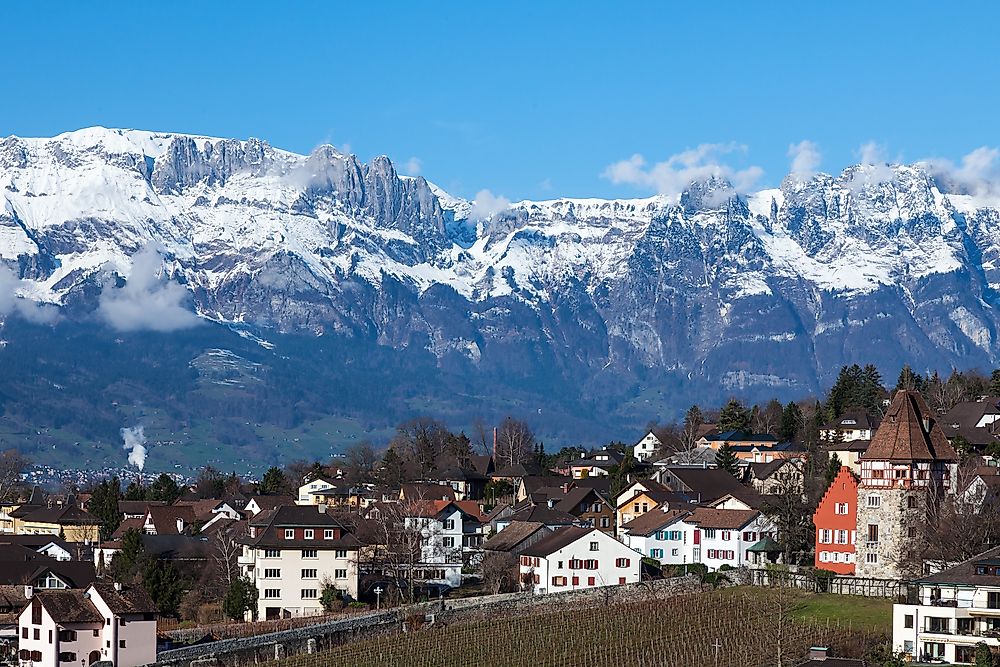
Liechtenstein ranks as the richest country in the world by GDP per capita (PPP) in 2025, at $201,110. This Alpine microstate has transformed from an agrarian society into one of the most industrialized nations globally. Its economy is driven by high-value exports such as precision instruments, dental products, and specialty machinery, alongside a robust financial sector. Over half its workforce commutes from neighboring countries, reflecting strong cross-border integration.
Liechtenstein uses the Swiss franc, shares a customs and monetary union with Switzerland, and benefits from EU market access via EFTA and the EEA. Its financial sector, known for favorable tax laws and corporate services, has been modernized to meet international transparency standards. Services account for nearly 58% of GDP, while industry contributes over 40%. Despite its small size, Liechtenstein invests heavily in research and development, underlining its focus on innovation and advanced manufacturing. Low unemployment and a AAA credit rating round out its economic strength.
2. Singapore - $156,969 GDP/Capita (PPP)

Singapore, a high-income economy, has the second-highest GDP/Capita (PPP) in the world as of 2025. It is recognized for its business-friendly regulatory environment and significant investments in infrastructure, education, healthcare, and public services. Since gaining independence in 1965, Singapore has transformed from a low-income to a high-income nation, experiencing remarkable GDP growth rates averaging about 7% annually.
This growth was initially fueled by rapid industrialization and manufacturing, which remains a key economic driver alongside the services sector. In 2024, Singapore's economy grew by 4.4%, with construction and services like accommodation and information and communications leading the growth. The "Singapore Green Plan 2030" was launched to promote sustainable development, aiming for net-zero emissions by 2050. Singapore also leads in human capital development, ranking highest in the World Bank Human Capital Index. The government's ongoing commitment includes initiatives like SkillsFuture, enhancing workforce adaptability and skill development.
3. Luxembourg - $152,394 GDP/Capita (PPP)

Luxembourg combines political stability and a multilingual talent pool with a deep fund-administration and banking ecosystem, giving it the world’s third-highest GDP per capita (PPP) in 2025. The Grand Duchy has moved far beyond its steel heritage into a diversified services economy where cross-border finance, investment funds, and corporate services anchor growth.
Today, the financial center operates within EU/OECD transparency standards, including automatic exchange of tax information, while retaining a pragmatic, business-friendly environment. Beyond finance, Luxembourg is a telecoms and satellite hub, home to SES, and is building strengths in ICT, data centers, and logistics. Tourism is modest but rising, supported by cultural sites and well-planned outdoor assets. Agriculture is small yet productive and backed by the EU’s Common Agricultural Policy. Looking ahead, Luxembourg is cultivating a space economy: a 2017 space-resources law and a 2020 space-activities law create a clear framework for companies exploring in-orbit services and resource utilization.
4. Ireland - $147,878 GDP/Capita (PPP)

Ireland ranks fourth globally by GDP per capita (PPP) in 2025, reflecting a high-income, FDI-driven economy rooted in the “Celtic Tiger” transformation of the late 1990s and 2000s. Today’s growth mix is anchored by technology, pharmaceuticals, and finance, supported by EU market access and an English-speaking, highly skilled workforce.
After a multinational-led dip in 2023, activity rebounded in 2024 with domestic sectors expanding, underscoring the economy’s resilience. The tax framework now combines Ireland’s long-standing 12.5% corporation tax for most companies with a 15% minimum effective rate for large multinationals, aligning with OECD rules while preserving competitiveness. Investment momentum remains solid, with strong project wins in 2024. Because multinational effects can inflate headline GDP, metrics like GNI* and modified domestic demand are often used alongside GDP to gauge underlying living standards.
5. Qatar - $122,283 GDP/Capita (PPP)

Qatar ranks among the world’s richest countries, 5th by GDP per capita (PPP) in 2025, with wealth anchored in vast natural-gas reserves and a leading LNG industry. Hydrocarbons still supply the bulk of export receipts and fiscal revenue, even as the GDP share has eased with steady diversification.
Policy is guided by Qatar National Vision 2030 and the Third National Development Strategy (2024-2030), which push private-sector growth, human capital, and non-oil services. The next leg of expansion comes from the North Field projects, set to lift LNG capacity from 2026 toward ~126 mtpa by 2027 and ~142 mtpa by 2030, underpinned by long-term supply deals and a rapidly growing tanker fleet. Regionally, relations normalized after the 2021 Al-Ula agreement, and Qatar remains closely tied to Asian energy markets while broadening finance, logistics, and tourism.
6. Norway - $106,694 GDP/Capita (PPP)

Norway ranks sixth globally by GDP per capita (PPP) in 2025, combining a high-income welfare state with an energy-rich, highly diversified economy. The country maintains significant public stakes in strategic sectors and is Europe’s largest supplier of natural gas, yet channels petroleum taxes, SDFI income and Equinor dividends into the Government Pension Fund Global, insulating the budget through a prudent fiscal rule.
In 2025, the IMF estimates nominal GDP to be about $517 billion, while petroleum’s net cash flow to the state is projected at NOK 664 billion; resources invested for the long term rather than spent outright. Beyond hydrocarbons, Norway’s “mainland” economy is service-led with advanced manufacturing, maritime, ICT, and green-technology niches, supporting high living standards and low unemployment by OECD norms. Policy remains focused on competitiveness and the energy transition, even as new licensing and large gas exports continue to underpin national income.
7. Switzerland - $97,659 GDP/Capita (PPP)

Switzerland consistently ranks among the world’s richest countries, currently 7th by GDP per capita (PPP) in 2025, with wealth built on political stability, rule of law, and a distinctive mix of high-value industry and finance. The country leads the world in wealth per adult, reflecting deep capital markets and household balance sheets. Its export engine is highly specialized: pharmaceuticals and chemicals now account for more than half of all exports, alongside precision machinery, medical tech, and watches. Inflation remains among the lowest in Europe, supported by a strong franc and credible monetary policy.
Switzerland’s financial center is large and outward-facing, operating under modern transparency frameworks, including the automatic exchange of information. The result is a small, open economy with very high living standards, underpinned by innovation, advanced manufacturing, and services that continue to support its place near the top of global income rankings.
8. Brunei - $94,472 GDP/Capita (PPP)

Brunei ranks among the world’s richest countries in 2025, powered by vast hydrocarbons and a long-established LNG export industry. Nominal GDP is ~$15.6 billion and population about 0.46 million, underscoring how resource wealth translates into very high income per person. Energy still anchors exports and fiscal receipts, while government debt remains exceptionally low (≈2.3% of GDP). Brunei LNG has been a stable supplier to Japan and other Asian buyers, reinforcing the country’s position in regional gas markets.
Diversification is advancing under Wawasan Brunei 2035, with downstream projects at Pulau Muara Besar and Sungai Liang Industrial Park (SPARK) and new petrochemicals capacity (e.g., Brunei Fertilizer Industries, Brunei Methanol Company). These initiatives broaden non-oil output across manufacturing, logistics, and halal industries while retaining a business-friendly environment.
9. Guyana - $94,189 GDP/Capita (PPP)

Guyana has vaulted into the global top tier by income as offshore oil reshapes its economy. In 2025, it ranks inside the world’s top ten by GDP per capita (PPP), up from low-middle-income status barely a decade ago. Real GDP jumped 43.6% in 2024, and the IMF still expects double-digit expansion as both oil and non-oil activity scale.
Production crossed ~645,000 barrels per day in early 2024 and climbed further in 2025 after ExxonMobil’s Yellowtail project achieved first oil, lifting installed capacity above 900,000 bpd and pushing monthly output into the high-600s. Additional sanctioned projects are set to take capacity above 1.3 million bpd later this decade. Public finances remain robust: the current account swung to a large surplus in 2024 on oil exports, while public debt is low by regional standards. Policy centers on saving through the Natural Resource Fund and investing in infrastructure and skills to broaden growth beyond hydrocarbons, key reasons Guyana now appears among the world’s richest on a PPP basis.
10. United States - $89,598 GDP/Capita (PPP)

The United States remains the world’s largest economy in 2025, with a nominal output of around $30.6 trillion, and ranks second by total GDP in terms of purchasing power behind China. On a per-person basis, America sits inside the global top ten, a reflection of a services-led, innovation-intensive economy spanning technology, finance, health care, and advanced manufacturing.
The IMF expects growth of about 2.0% in 2025 after a strong 2024, with an investment boom around artificial intelligence helping sustain demand and capital spending. Deep capital markets, leading universities, and high R&D intensity continue to attract talent and funding, while productivity trends and immigration policy will shape medium-term performance. New York remains a global financial hub and the U.S. dominates venture funding and tech platforms, supporting high living standards relative to most advanced economies. In PPP size, the U.S. trails only China, but by income, it remains among the world’s richest economies.
Other Rich Regions

Macao SAR, Taiwan Province of China, and Hong Kong SAR are three economies that routinely appear near the top of global income tables on a purchasing-power-parity basis, though they are not UN member states. Macao’s prosperity is anchored in tourism and gaming; in 2025 its GDP per capita (PPP) is about $132,650, reflecting a full return of visitors and the city’s role as a major entertainment hub.
Taiwan’s wealth rests on world-leading semiconductor and electronics supply chains, with PPP income around $85,100 in 2025; this high-tech base keeps the economy deeply plugged into global manufacturing and innovation networks.
Hong Kong remains a premier global financial centre, posting PPP income near $78,900 in 2025 while leveraging deep capital markets, efficient regulation, and a strategic location in Asian finance.
Despite different economic structures, all three share strong institutions, high levels of human capital, and intense integration with global trade and investment. Their constitutional arrangements, as Special Administrative Regions in the case of Macao and Hong Kong, and a politically complex, trade-dependent economy in Taiwan, afford substantial economic autonomy while tying them closely to broader national and international relationships. They thus rank among the world’s richest.
Countries Ranked By GDP/Capita (PPP)
| Rank | Country | GDP/Capita (PPP) |
|---|---|---|
| - | Afghanistan | no data |
| - | Eritrea | no data |
| - | Lebanon | no data |
| - | Sri Lanka | no data |
| - | Syria | no data |
| - | West Bank and Gaza | no data |
| 1 | Liechtenstein | $201,112.30 |
| 2 | Singapore | $156,969.10 |
| 3 | Luxembourg | $152,394.60 |
| 4 | Ireland | $147,878.20 |
| * | Macao SAR | $132,648.30 |
| 5 | Qatar | $122,283.20 |
| 6 | Norway | $106,694.10 |
| 7 | Switzerland | $97,659.28 |
| 8 | Brunei Darussalam | $94,472.47 |
| 9 | Guyana | $94,189.30 |
| 10 | United States | $89,598.86 |
| * | Taiwan Province of China | $85,126.91 |
| 11 | Denmark | $84,762.88 |
| 12 | United Arab Emirates | $84,402.77 |
| 13 | Netherlands | $84,035.22 |
| 14 | San Marino | $82,886.41 |
| 15 | Iceland | $80,466.38 |
| * | Hong Kong SAR | $78,918.79 |
| 16 | Malta | $78,710.89 |
| 17 | Belgium | $75,882.37 |
| 18 | Austria | $74,852.29 |
| 19 | Saudi Arabia | $74,668.07 |
| 20 | Germany | $73,553.30 |
| 21 | Sweden | $73,069.51 |
| 22 | Andorra | $72,359.32 |
| 23 | Australia | $71,430.89 |
| 24 | Bahrain | $69,270.72 |
| 25 | Finland | $66,512.47 |
| 26 | France | $66,060.53 |
| 27 | Canada | $65,500.25 |
| 28 | Cyprus | $65,304.13 |
| 29 | Korea, Republic of | $65,080.29 |
| 30 | United Kingdom | $63,759.05 |
| 31 | Italy | $63,125.68 |
| 32 | Czech Republic | $59,853.14 |
| 33 | Slovenia | $57,716.48 |
| 34 | Lithuania | $57,201.43 |
| 35 | Spain | $56,887.93 |
| 36 | New Zealand | $55,781.20 |
| 37 | Israel | $55,766.41 |
| 38 | Poland | $55,340.22 |
| 39 | Japan | $54,815.32 |
| 40 | Kuwait | $52,866.10 |
| * | Puerto Rico | $51,488.64 |
| 41 | Croatia | $51,453.31 |
| 42 | Portugal | $49,753.19 |
| * | Aruba | $49,451.39 |
| 43 | Estonia | $49,087.45 |
| 44 | Russian Federation | $49,048.99 |
| 45 | Romania | $48,847.46 |
| 46 | Hungary | $48,156.87 |
| 47 | Slovak Republic | $47,596.54 |
| 48 | Greece | $44,985.38 |
| 49 | Kazakhstan | $44,777.87 |
| 50 | Latvia | $44,105.52 |
| 51 | Türkiye, Republic of | $43,786.20 |
| 52 | Malaysia | $43,664.71 |
| 53 | Panama | $43,651.39 |
| 54 | Bulgaria | $42,477.29 |
| 55 | Oman | $42,211.20 |
| 56 | Seychelles | $42,110.40 |
| 57 | Bahamas, The | $42,002.51 |
| 58 | Uruguay | $37,190.13 |
| 59 | Maldives | $36,065.76 |
| 60 | Trinidad and Tobago | $35,899.58 |
| 61 | Chile | $35,286.47 |
| 62 | Montenegro | $34,407.85 |
| 63 | Saint Kitts and Nevis | $34,096.36 |
| 64 | Belarus | $34,069.08 |
| 65 | Mauritius | $33,023.74 |
| 66 | Serbia | $32,741.87 |
| 67 | Costa Rica | $31,485.04 |
| 68 | Antigua and Barbuda | $31,380.29 |
| 69 | Argentina | $31,311.01 |
| 70 | Georgia | $31,089.68 |
| 71 | Dominican Republic | $30,537.61 |
| 72 | North Macedonia | $29,509.92 |
| 73 | Saint Lucia | $29,257.60 |
| 74 | China, People's Republic of | $29,191.10 |
| 75 | Thailand | $26,358.58 |
| 76 | Azerbaijan | $26,081.08 |
| 77 | Mexico | $25,770.39 |
| 78 | Gabon | $24,738.80 |
| 79 | Armenia | $23,954.24 |
| 80 | Albania | $23,327.05 |
| 81 | Brazil | $23,309.63 |
| 82 | Barbados | $23,183.92 |
| 83 | Turkmenistan | $22,855.95 |
| 84 | Bosnia and Herzegovina | $22,829.68 |
| 85 | Colombia | $22,396.00 |
| 86 | Suriname | $22,303.23 |
| 87 | Egypt | $21,758.84 |
| 88 | Iran | $21,473.13 |
| 89 | Grenada | $21,414.45 |
| 90 | Saint Vincent and the Grenadines | $21,235.18 |
| 91 | Ukraine | $20,903.94 |
| 92 | Equatorial Guinea | $20,493.83 |
| * | Kosovo | $20,392.96 |
| 93 | Mongolia | $20,378.30 |
| 94 | Paraguay | $19,717.19 |
| 95 | Moldova | $19,590.73 |
| 96 | Dominica | $19,381.06 |
| 97 | Botswana | $19,053.10 |
| 98 | Peru | $18,980.19 |
| 99 | Palau | $18,958.27 |
| 100 | Algeria | $18,509.45 |
| 101 | Libya | $17,930.65 |
| 102 | Bhutan | $17,721.79 |
| 103 | Vietnam | $17,688.25 |
| 104 | Indonesia | $17,633.89 |
| 105 | Ecuador | $16,805.02 |
| 106 | Fiji | $16,366.01 |
| 107 | South Africa | $16,049.82 |
| 108 | Iraq | $15,390.57 |
| 109 | Guatemala | $15,100.09 |
| 110 | Tunisia | $14,982.77 |
| 111 | Belize | $14,920.77 |
| 112 | Jamaica | $13,924.09 |
| 113 | El Salvador | $13,876.77 |
| 114 | Eswatini | $13,310.11 |
| 115 | Philippines | $12,920.04 |
| 116 | Uzbekistan | $12,558.99 |
| 117 | Namibia | $12,341.51 |
| 118 | Cabo Verde | $12,335.27 |
| 119 | Nauru | $12,267.63 |
| 120 | India | $12,100.97 |
| 121 | Jordan | $11,510.85 |
| 122 | Bolivia | $11,439.02 |
| 123 | Morocco | $11,437.15 |
| 124 | Bangladesh | $10,257.55 |
| 125 | Angola | $10,216.56 |
| 126 | Lao P.D.R. | $10,212.33 |
| 127 | Nigeria | $9,488.16 |
| 128 | Djibouti | $9,407.65 |
| 129 | Nicaragua | $9,081.75 |
| 130 | Kyrgyz Republic | $8,870.37 |
| 131 | Venezuela | $8,785.45 |
| 132 | Mauritania | $8,774.94 |
| 133 | Cambodia | $8,707.07 |
| 134 | Ghana | $8,410.29 |
| 135 | Samoa | $8,257.26 |
| 136 | Côte d'Ivoire | $8,112.67 |
| 137 | Tonga | $8,086.18 |
| 138 | Honduras | $7,955.75 |
| 139 | Zimbabwe | $7,842.81 |
| 140 | Marshall Islands | $7,704.43 |
| 141 | Kenya | $7,556.08 |
| 142 | Pakistan | $6,949.90 |
| 143 | Congo, Republic of | $6,515.36 |
| 144 | São Tomé and Príncipe | $6,459.87 |
| 145 | Tuvalu | $6,158.00 |
| 146 | Nepal | $6,139.80 |
| 147 | Tajikistan | $6,088.85 |
| 148 | Cameroon | $5,791.09 |
| 149 | Senegal | $5,354.70 |
| 150 | Timor-Leste | $5,018.75 |
| 151 | Myanmar | $4,950.86 |
| 152 | Micronesia, Fed. States of | $4,760.79 |
| 153 | Guinea | $4,751.12 |
| 154 | Benin | $4,719.24 |
| 155 | Zambia | $4,503.43 |
| 156 | Ethiopia | $4,419.78 |
| 157 | Tanzania | $4,371.13 |
| 158 | Rwanda | $4,100.68 |
| 159 | Comoros | $4,015.31 |
| 160 | Uganda | $3,904.25 |
| 161 | Papua New Guinea | $3,761.99 |
| 162 | Kiribati | $3,704.85 |
| 163 | Sierra Leone | $3,699.42 |
| 164 | Gambia, The | $3,680.03 |
| 165 | Togo | $3,372.91 |
| 166 | Guinea-Bissau | $3,279.35 |
| 167 | Chad | $3,155.03 |
| 168 | Lesotho | $3,089.29 |
| 169 | Burkina Faso | $3,019.01 |
| 170 | Vanuatu | $2,995.60 |
| 171 | Haiti | $2,976.22 |
| 172 | Mali | $2,889.97 |
| 173 | Solomon Islands | $2,711.60 |
| 174 | Sudan | $2,418.62 |
| 175 | Niger | $2,095.24 |
| 176 | Madagascar | $2,039.72 |
| 177 | Congo, Dem. Rep. of the | $1,974.51 |
| 178 | Liberia | $1,960.93 |
| 179 | Somalia | $1,897.72 |
| 180 | Malawi | $1,757.70 |
| 181 | Mozambique | $1,732.60 |
| 182 | Yemen | $1,673.72 |
| 183 | Central African Republic | $1,369.33 |
| 184 | Burundi | $989.30 |
| 185 | South Sudan, Republic of | $953.68 |
*Macao and Hong Kong are both Special Administrative Regions of the People’s Republic of China. Taiwan Province of China is considered by the UN to be part of the PRC. Puerto Rico is an unincorporated territory of the United States. Aruba is a constituent country within the Kingdom of the Netherlands but is not a UN member. Kosovo is recognized by many states but is not a UN member (status disputed.)
Discover More Rich Countries
The Richest Countries In Europe
Liechtenstein, Luxembourg, and Ireland rank as the three richest countries in Europe for 2025 with a GDP/Capita in PPP of $201,112, $152,394, and $147,878, respectively.
The Richest Countries In Asia
Singapore, Qatar and Brunei are currently the richest countries in Asia for 2025, with GDP/Capita in PPP of $156,969, $122,283, and $94,472, respectively.
The Richest Countries In North America
The United States, Canada, and Panama are the richest countries in North America for 2025, with GDP/Capita in PPP of $89,598, $65,500, and $43,651, respectively.
The Richest Countries In South America
Guyana, Uruguay, and Chile are the richest countries in South America for 2025, with GDP/Capita in PPP of $94,189, $37,190, and $35,286, respectively.
The Richest Countries In Africa
Seychelles, Mauritius, and Gabon are the richest countries in Africa for 2025, with GDP/Capita in PPP of $42,110, $33,023, and $24,738, respectively.
The Richest Countries In South Asia
The Maldives, Bhutan, and India are the richest countries in South Asia for 2025, with a GDP/Capita in PPP of $36,065, $17,721, and $12,100, respectively.