The Sea Levels Rising Fastest Along US Coasts
The sea is not rising politely, in one even sheet, all along the American coast. It is racing in some places and loitering in others, mainly because the ocean is pushing up while the land, in a lot of these spots, sinks quietly to meet it. Grand Isle, Louisiana, is where that contest runs hottest, roughly 8.2 millimeters a year, with the Texas Gulf and a stretch of the Mid-Atlantic close on its heels. What follows is the leaderboard, drawn from the Virginia Institute of Marine Science's 2024 report cards, which measure every gauge against the same 1969 starting line so the race is fair.
Grand Isle, Louisiana, 8.2 Millimeters Per Year

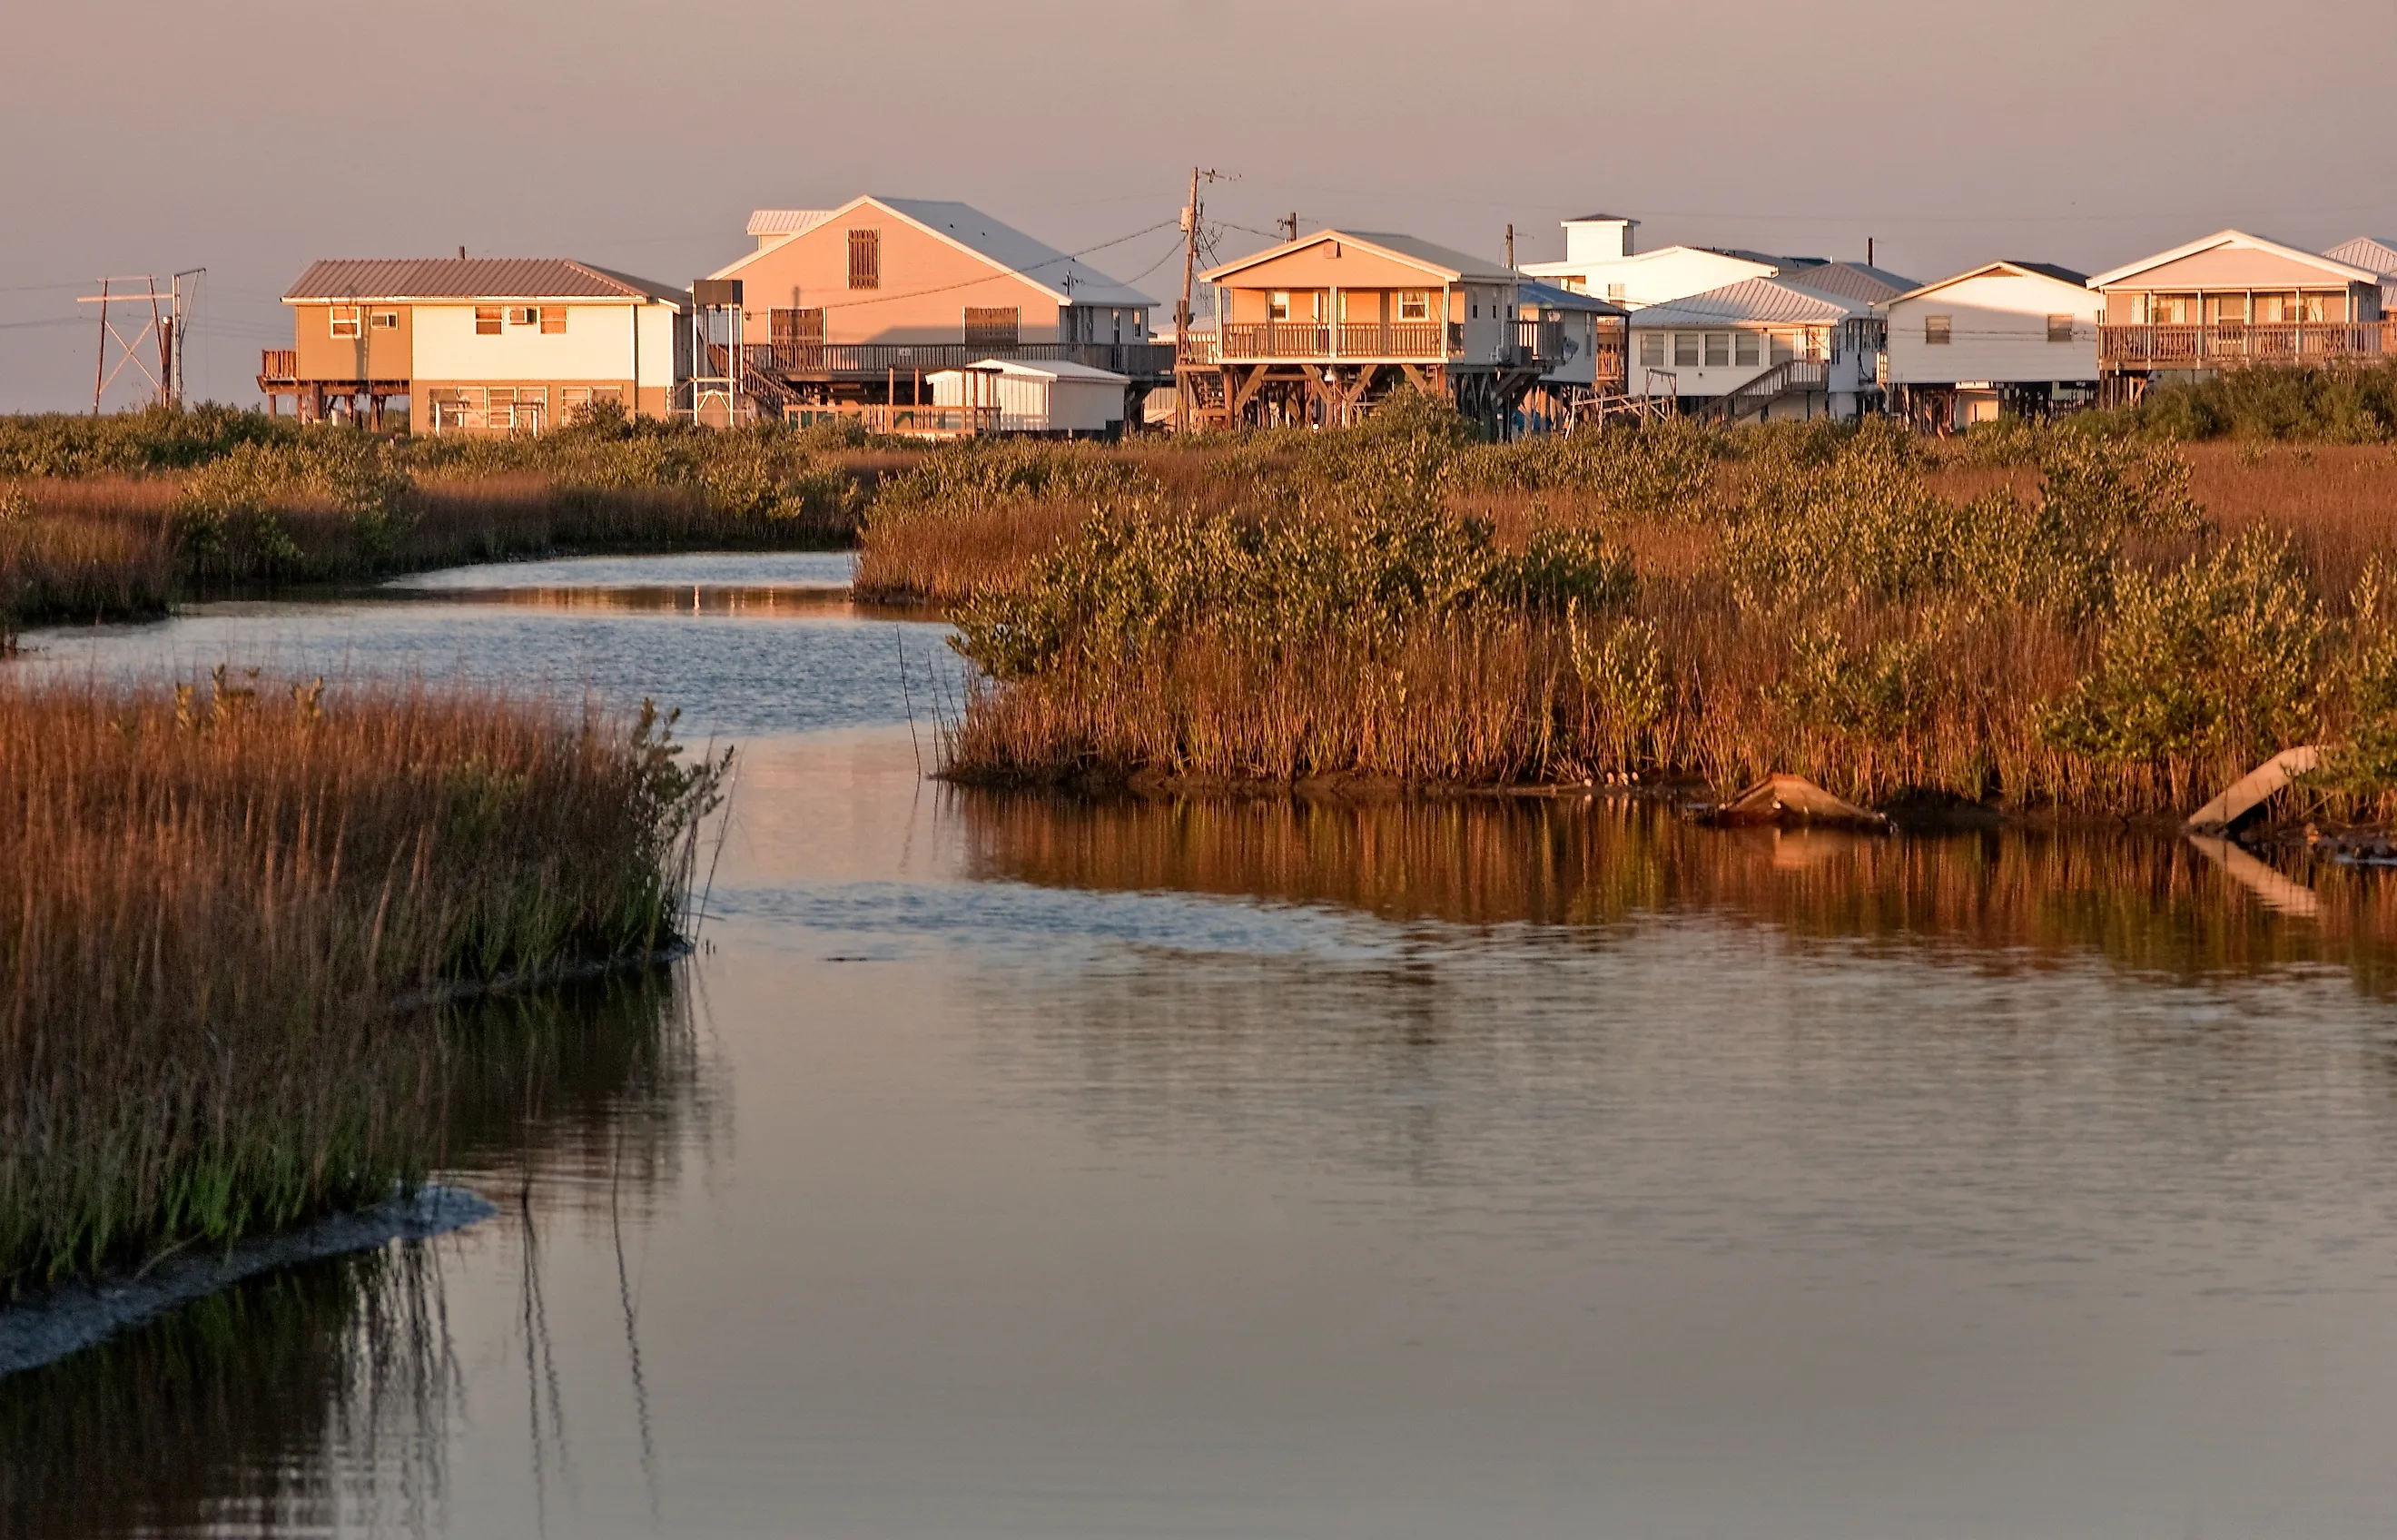
Grand Isle sits near the mouth of the Mississippi River on a barrier island built largely from relatively young delta sediment. VIMS puts its post-1969 relative sea-level trend at roughly 8.2 millimeters per year, the highest rate among the locations in its report-card system.
The ground beneath coastal Louisiana has been sinking for a long time. Thick deposits of mud, sand, and organic material compact after burial, lowering the surface above them. Oil and gas extraction added to subsidence in parts of the delta during the 20th century. More recent work has also found rapid regional ocean rise along the Louisiana coast, so the modern trend cannot be assigned to subsidence alone. Both parts of the tide-gauge measurement are moving.
Rockport, Texas, 7.2 Millimeters Per Year

Rockport's trend is about 7.2 millimeters per year. The gauge faces Aransas Bay on the central Texas coast, and VIMS has placed the location near the top of its national comparison for several consecutive report cards.
Its history differs from Galveston's. Heavy groundwater and hydrocarbon withdrawal caused severe subsidence around parts of the Houston-Galveston region, but VIMS says Rockport probably did not experience subsidence of that scale. The high rate at Rockport is therefore not simply a legacy of the extreme pumping that affected other parts of the Texas coast. Regional sea-level change and local vertical land movement both contribute to what the gauge records.
Galveston, Texas, 6.9 Millimeters Per Year

The tide gauge at Galveston Pier 21 has been recording water levels for more than a century. A peer-reviewed analysis covering 1909 through 2018 found a long-term relative sea-level trend of about 6.5 millimeters per year. VIMS's post-1969 estimate is roughly 6.9 millimeters per year.
Groundwater pumping once dominated much of the local signal. Water withdrawn from aquifers beneath the Houston-Galveston area allowed underground sediments to compact, lowering the land surface. Researchers estimate that subsidence accounted for a very large share of Galveston's relative sea-level rise during parts of the 20th century.
Pumping controls introduced from the 1970s onward reduced that rate of subsidence. Studies of the longer record show the balance changing through time, with rising ocean levels taking a larger share of Galveston's recent increase than they did several decades ago.
Norfolk, Virginia, 5.6 Millimeters Per Year

Norfolk's Sewells Point gauge records a post-1969 trend of about 5.6 millimeters per year. That makes southeastern Virginia one of the fastest-rising parts of the Atlantic Coast in the VIMS dataset.
Some of the movement comes from the land. The Mid-Atlantic is still responding to the disappearance of the continental ice sheet that covered areas farther north during the last Ice Age. Land around the former edge of that ice load had been pushed upward and has been slowly settling ever since. Groundwater withdrawal has caused additional subsidence in parts of southeastern Virginia. Changes in Atlantic circulation can alter coastal water levels as well, especially around the region north of Cape Hatteras.
Yorktown, Virginia, 5.4 Millimeters Per Year

Yorktown follows at about 5.4 millimeters per year. Its proximity to Norfolk matters because the two gauges point to the same broader pattern across the lower Chesapeake Bay rather than an isolated local anomaly.
The modern NOAA gauge at Yorktown began operating in 2004, but the local record can be extended with observations from the former Gloucester Point station across the York River. That gauge operated until Hurricane Isabel destroyed it in 2003. VIMS adjusts and combines the records when examining the longer-term trend.
Land subsidence from glacial isostatic adjustment affects this part of Virginia, while rising Atlantic water levels add to the relative change measured at the coast. Yorktown and Norfolk differ by only about 0.2 millimeter per year in the latest VIMS figures.
Port Isabel, Texas, 5.2 Millimeters Per Year

Port Isabel, beside the Laguna Madre and across the water from South Padre Island, has a relative sea-level trend of about 5.2 millimeters per year. Its position near the southern tip of the Texas coast puts the gauge in a broad, low-lying coastal plain.
There is no evidence that Port Isabel experienced the severe withdrawal-driven subsidence documented around Galveston. VIMS specifically identifies Port Isabel as one of the Texas locations that probably avoided that extreme history. The gauge still records land movement, but its high rate cannot be explained by groundwater and hydrocarbon extraction alone.
Solomons Island, Maryland, 5.2 Millimeters Per Year

Solomons Island also records about 5.2 millimeters per year. VIMS added the Maryland locality to its report-card comparison for 2024, although the NOAA tide gauge there has operated since 1937.
The western shore of the Chesapeake sits within the Mid-Atlantic zone affected by glacial isostatic adjustment. During the last Ice Age, the enormous weight of ice farther north altered the shape of the crust well beyond the edge of the ice sheet. Parts of the land that rose around that margin have been settling for thousands of years. Rising ocean levels are superimposed on that downward movement. The rate at Solomons is higher than the corresponding VIMS trends at Annapolis and Baltimore farther north.
Sandy Hook, New Jersey, 4.8 Millimeters Per Year

Sandy Hook, the narrow peninsula at the entrance to New York Harbor, records about 4.8 millimeters of relative sea-level rise per year. New Jersey lies near the part of the Atlantic Coast where subsidence from glacial isostatic adjustment is strongest.
VIMS cites estimates of roughly 1.5 millimeters per year of land sinking around New Jersey from that process. The tide-gauge trend is higher because the ocean is rising at the same time. Thermal expansion, added water from melting land ice, and regional ocean circulation all affect sea-surface height, while the land beneath the gauge continues its slow downward movement.
Why The Gulf And Mid-Atlantic Have The Highest Rates
The fastest VIMS rates are concentrated along the Gulf Coast and the Mid-Atlantic. The causes are not identical. Louisiana's delta sediments compact naturally, Galveston has a long history of pumping-related subsidence, and the Chesapeake and New Jersey are affected by slow crustal adjustment left over from the last Ice Age.
Grand Isle remains the outlier at about 8.2 millimeters per year. If that rate stayed unchanged for 25 years, it would amount to roughly eight inches of additional relative sea-level rise.