Cities With The Worst Air Quality In North America
By the numbers in one widely cited global survey, the worst urban air in North America belongs not to a giant capital but to Monterrey, the industrial powerhouse of northeastern Mexico. Mexican cities fill six of the ten worst-ranked spots, with the rest of the list spread across California's farm country, a handful of Central American capitals, and several towns in Jamaica. The rankings come from the World Health Organization's Global Urban Ambient Air Pollution Database, which compared annual dust levels in hundreds of cities. The key measure is PM10: airborne particles smaller than 10 micrometers across, fine enough to slip past the nose and throat and settle deep in the lungs. Most of it comes from burning fuel, whether in car engines, factories, power plants, or household stoves. One note on geography: North America here means the whole continent, so Central American and Caribbean cities sit on the list alongside those in the United States, Mexico, and Canada.
Worst Air Quality In North America
The pattern is strongly regional, with a few countries accounting for most of the worst readings.
Mexico
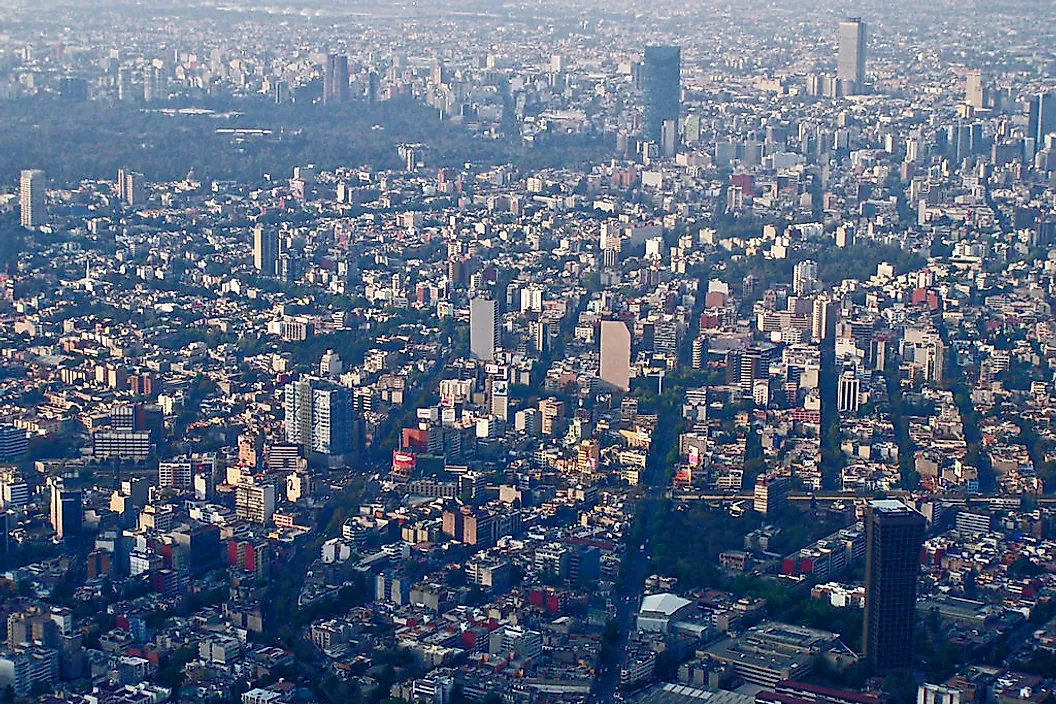
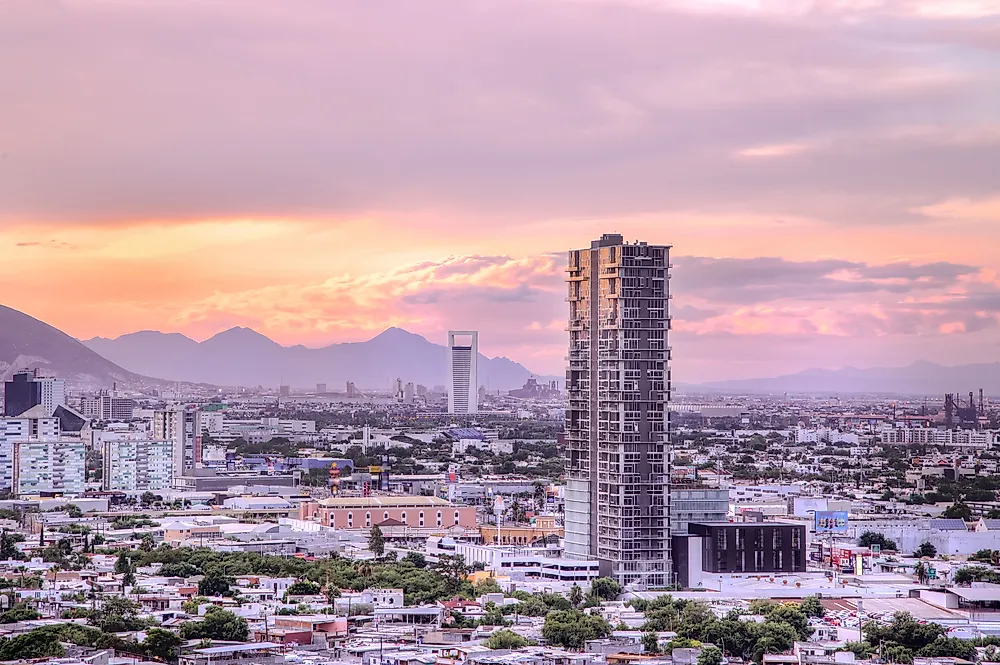
Mexico dominates the rankings, holding six of the ten worst spots. Monterrey, in the northern state of Nuevo León, leads with an annual PM10 average of 86 micrograms per cubic meter, more than four times the WHO's older guideline limit of 20 and far above the stricter limit of 15 it adopted in 2021. The metropolitan area is the country's industrial capital, home to more than five million people and ringed by mountains that trap exhaust and factory emissions close to the ground. Toluca, the capital of the State of Mexico and a major manufacturing center in its own right, ranks second at 80. Most of the remaining Mexican entries cluster in the Bajío industrial corridor of Guanajuato state, where Salamanca, León, Irapuato, and Silao combine heavy industry, oil refining, and growing traffic. Mexico City itself, long synonymous with smog, actually sits lower on this list at 42, the result of decades of emissions controls, factory relocations, and cleaner fuels.
The United States

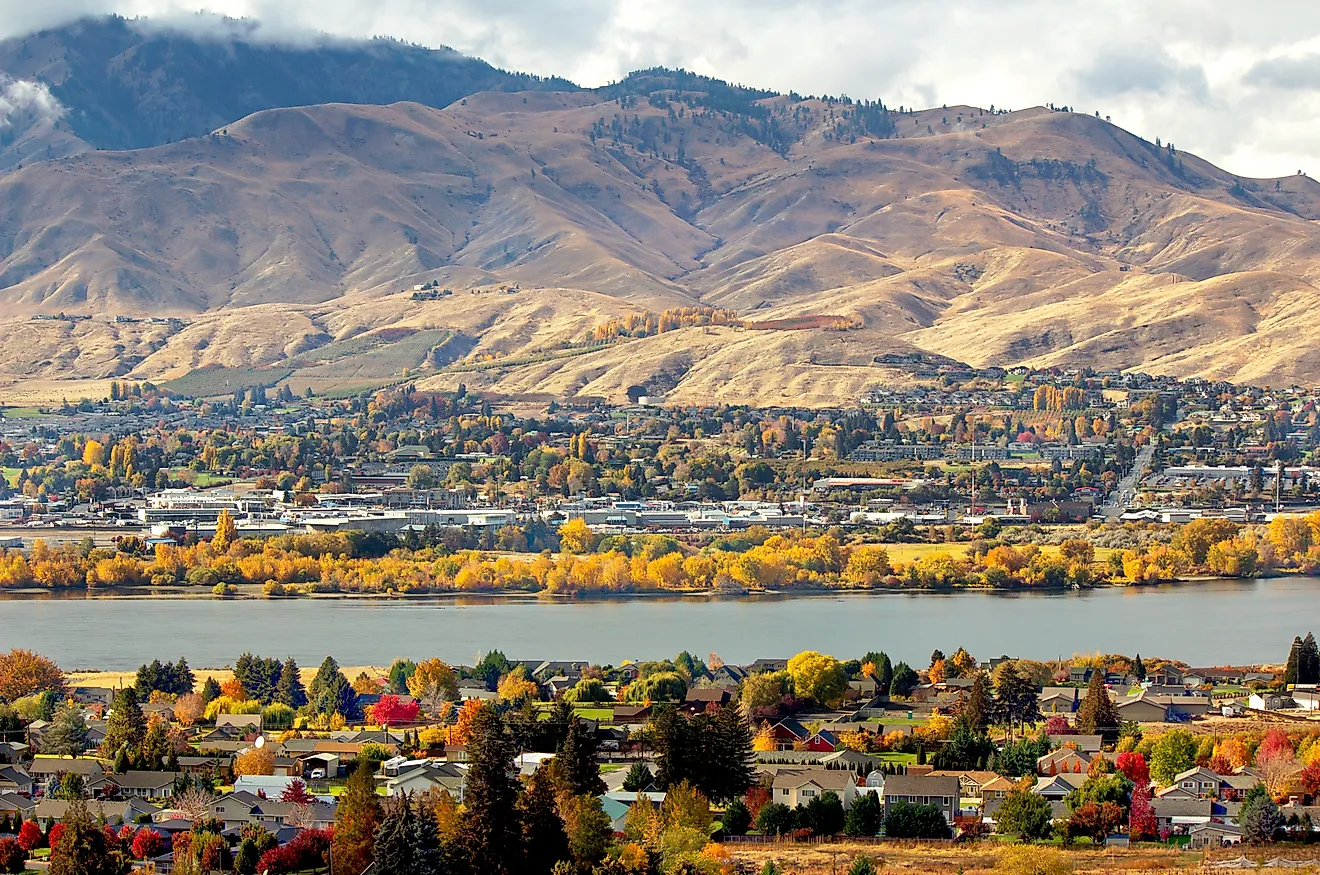
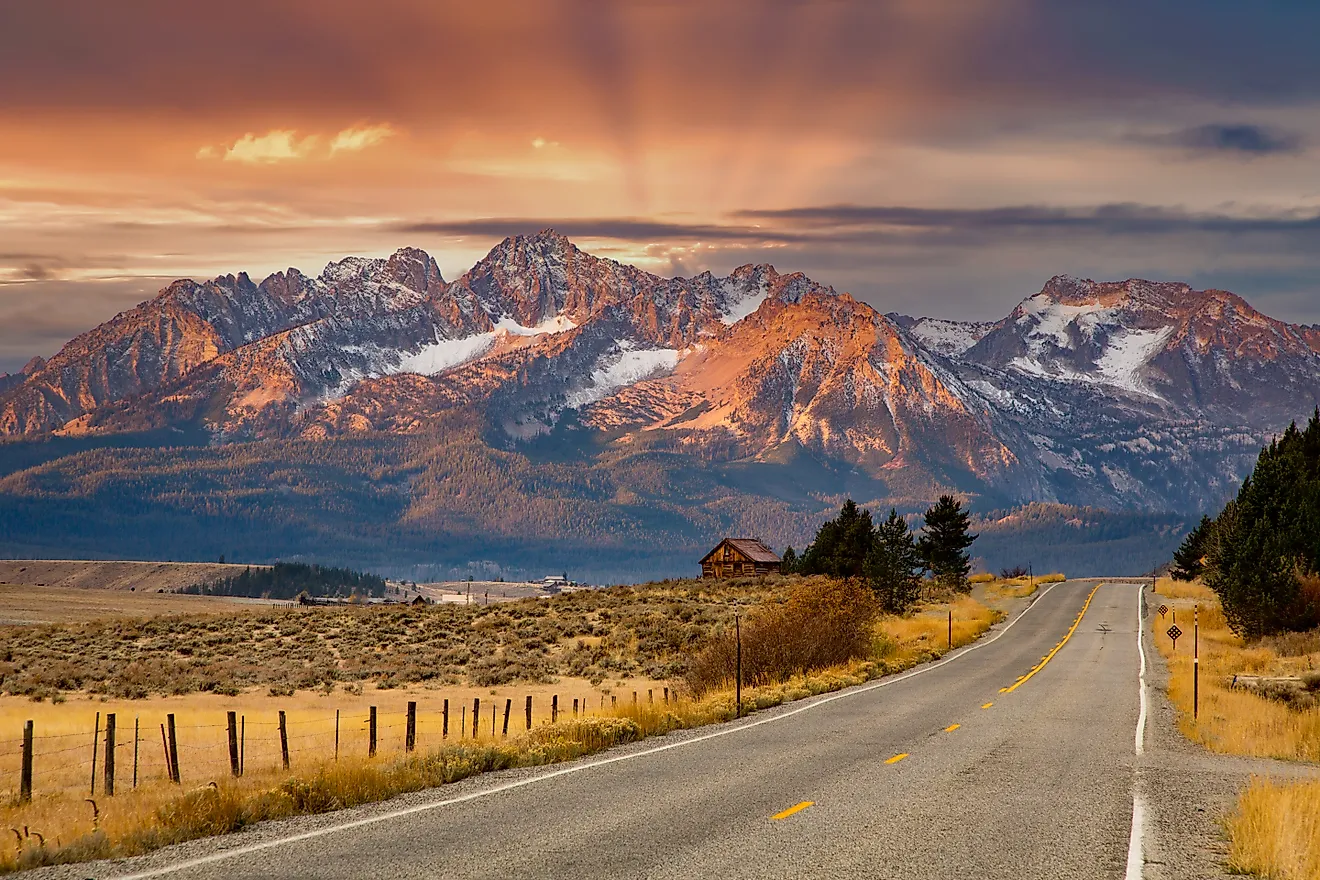
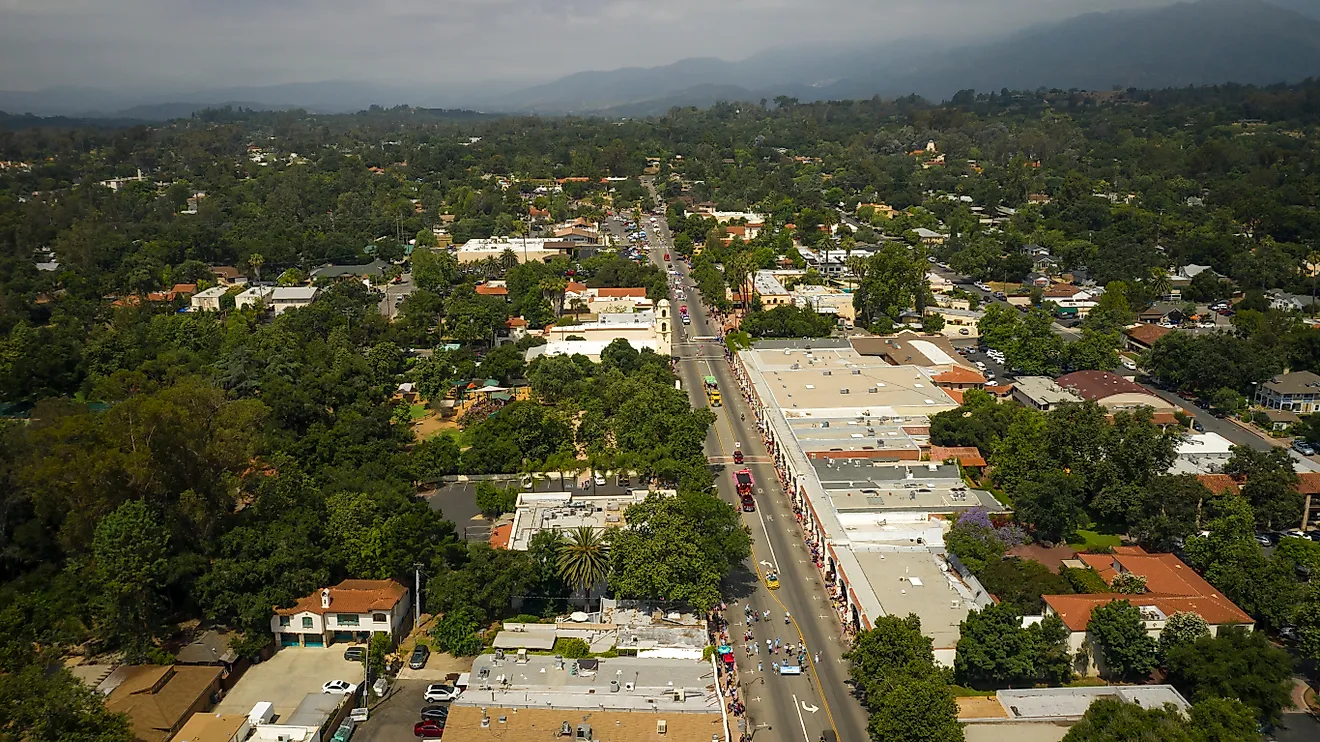
In the United States, the worst readings come almost entirely from California's San Joaquin Valley. Visalia-Porterville, Hanford-Corcoran, Fresno, and Madera all appear in the lower half of the ranking, and the cause is geography as much as emissions. The valley is a long bowl walled in by mountains, and in calm weather it traps vehicle exhaust, diesel fumes from freight traffic, dust and smoke from farming, and pollution from oil production. The American Lung Association has ranked valley cities such as Bakersfield, Fresno, and Visalia among the most particle-polluted in the country for years. Portola, a small town in the Sierra Nevada, makes the list largely because of wood smoke and wildfire haze, while Elkhart-Goshen in Indiana is the lone Midwestern entry, tied to its heavy manufacturing base.
Central America

Several Central American capitals rank high as well. San Salvador, the capital of El Salvador, sits third overall at 77, while Tegucigalpa in Honduras and Guatemala City both land in the top ten. Costa Rica accounts for a whole cluster of entries, including Heredia, Belén, Alajuela, Cartago, and the capital, San José, and Panama City rounds out the region. The mix across much of Central America is familiar: aging vehicle fleets, the burning of wood and crop waste, and valley settings that keep pollution from dispersing.
Jamaica And The Caribbean

Jamaica contributes five entries to the regional list. The worst is Portmore at 54, followed by the capital, Kingston, then Vere Plains in Clarendon, Old Harbour Plains in St. Catherine, and South Eastern Manchester. Vehicle emissions and road dust are common contributors across the island's urban parishes.
Canada

Canada barely registers. Just one Canadian community, Courtenay on Vancouver Island in British Columbia, appears in the top thirty, at 30 micrograms per cubic meter. Its readings owe more to residential wood smoke and the occasional drift of wildfire haze than to heavy industry. Air quality nationwide is overseen by the Canadian Council of Ministers of the Environment, which sets shared standards across the country's provinces and territories.
How Air Pollution Is Measured
Air quality is usually described by the concentration of particulate matter, measured in micrograms per cubic meter of air. PM10 covers coarse particles up to 10 micrometers across, while PM2.5 refers to finer particles no larger than 2.5 micrometers, which penetrate even deeper into the lungs and can cross into the bloodstream. The rankings on this page use PM10, the measure the WHO database emphasized when these readings were collected, roughly between 2008 and 2013. Under the WHO's 2021 guidelines, annual PM2.5 should stay at or below 5 micrograms per cubic meter and PM10 at or below 15, both far stricter than the 2005 limits of 10 and 20. By either standard, almost every city on this list breathes air well above what the WHO considers safe. Most air-quality reporting now leads with PM2.5 rather than PM10, and the WHO has revised its database several times since, most recently in 2024.
The Health Effects Of Air Pollution
Fine particles are dangerous precisely because they are easy to ignore. They are invisible at street level, yet over time they take a real toll. Short-term exposure can bring itchy eyes, coughing, wheezing, headaches, chest tightness, and shortness of breath, and it can set off asthma attacks. Sustained exposure is linked to chronic respiratory disease, heart disease, stroke, and lung cancer. The risks fall hardest on children, older adults, and people with existing heart or lung conditions, and they worsen where weather and terrain keep pollution trapped over a city. Globally, the WHO estimates that outdoor air pollution caused about 4.2 million premature deaths in 2019, most of them from heart disease and stroke.
Cities With The Worst Air Quality In North America
The full ranking below is drawn from the WHO Global Urban Ambient Air Pollution Database, released in 2016 using annual mean PM10 measurements gathered over the preceding years. The figures are a historical snapshot rather than a live reading, and the WHO has since published newer data, but the table shows how North American cities compared when the survey was compiled.
| Rank | City/Town | Country | Average PM10 (µg/m³) |
|---|---|---|---|
| 1 | Monterrey | Mexico | 86 |
| 2 | Toluca | Mexico | 80 |
| 3 | San Salvador | El Salvador | 77 |
| 4 | Salamanca | Mexico | 60 |
| 5 | Tegucigalpa | Honduras | 59 |
| 6 | León | Mexico | 58 |
| 7 | Guatemala City | Guatemala | 56 |
| 8 | Irapuato | Mexico | 55 |
| 9 | Portmore | Jamaica | 54 |
| 10 | Silao | Mexico | 51 |
| 11 | Kingston | Jamaica | 48 |
| 12 | Heredia | Costa Rica | 47 |
| 13 | Mexico City | Mexico | 42 |
| 14 | Vere Plains, Clarendon | Jamaica | 42 |
| 15 | Guadalajara | Mexico | 41 |
| 16 | Old Harbour Plains, St. Catherine | Jamaica | 34 |
| 17 | Visalia-Porterville | United States | 33 |
| 18 | Puebla | Mexico | 32 |
| 19 | Panama City | Panama | 31 |
| 20 | Belén | Costa Rica | 31 |
| 21 | Hanford-Corcoran | United States | 30 |
| 22 | Courtenay | Canada | 30 |
| 23 | Portola, Plumas | United States | 29 |
| 24 | Alajuela | Costa Rica | 28 |
| 25 | Fresno | United States | 28 |
| 26 | Elkhart-Goshen | United States | 28 |
| 27 | Cartago | Costa Rica | 27 |
| 28 | San José | Costa Rica | 27 |
| 29 | Madera | United States | 26 |
| 30 | South Eastern Manchester | Jamaica | 25 |
A Snapshot That Keeps Changing
Air quality is not fixed, and several places on this list have changed since the survey was taken. Mexico City's long campaign against smog has continued, and California's valley cities, though still among the worst in the United States, have lately posted some of their cleanest readings in years thanks to tighter vehicle and industrial rules. At the same time, worsening wildfire seasons across the western United States and Canada have driven particle levels back up on the worst days, a problem that barely registered in the original data. What has not changed is the lesson behind the numbers: where people burn the most fuel and the land holds the air still, the particles build up, and the people who live there pay for it in their health.