Most Ethnically Diverse Countries In The World
Pick two people at random in Papua New Guinea and the odds are almost perfect that they belong to different ethnic groups. That is not a figure of speech; it is essentially what it means to score a 1.0000 on the measure behind this list. An ethnic group is a set of people bound by some mix of shared ancestry, language, culture, and history, and some countries pack in far more of them than others. Size helps, so does rugged terrain that keeps communities apart, and so do centuries of migration. The result is that a handful of countries are astonishingly varied, and the numbers behind them are worth a closer look.
The ranking here comes from political scientist James Fearon's 2003 study of ethnic diversity, which scored 160 countries on a scale where 1 means near-total fragmentation and 0 means everyone belongs to a single group. Fearon's measure is weighted heavily toward language, and it counts only groups making up at least 1% of a country's population. Because the underlying data was gathered around the turn of the millennium, the list carries a few countries that have since split or dissolved, a quirk worth keeping in mind as you read down it.
1. Papua New Guinea

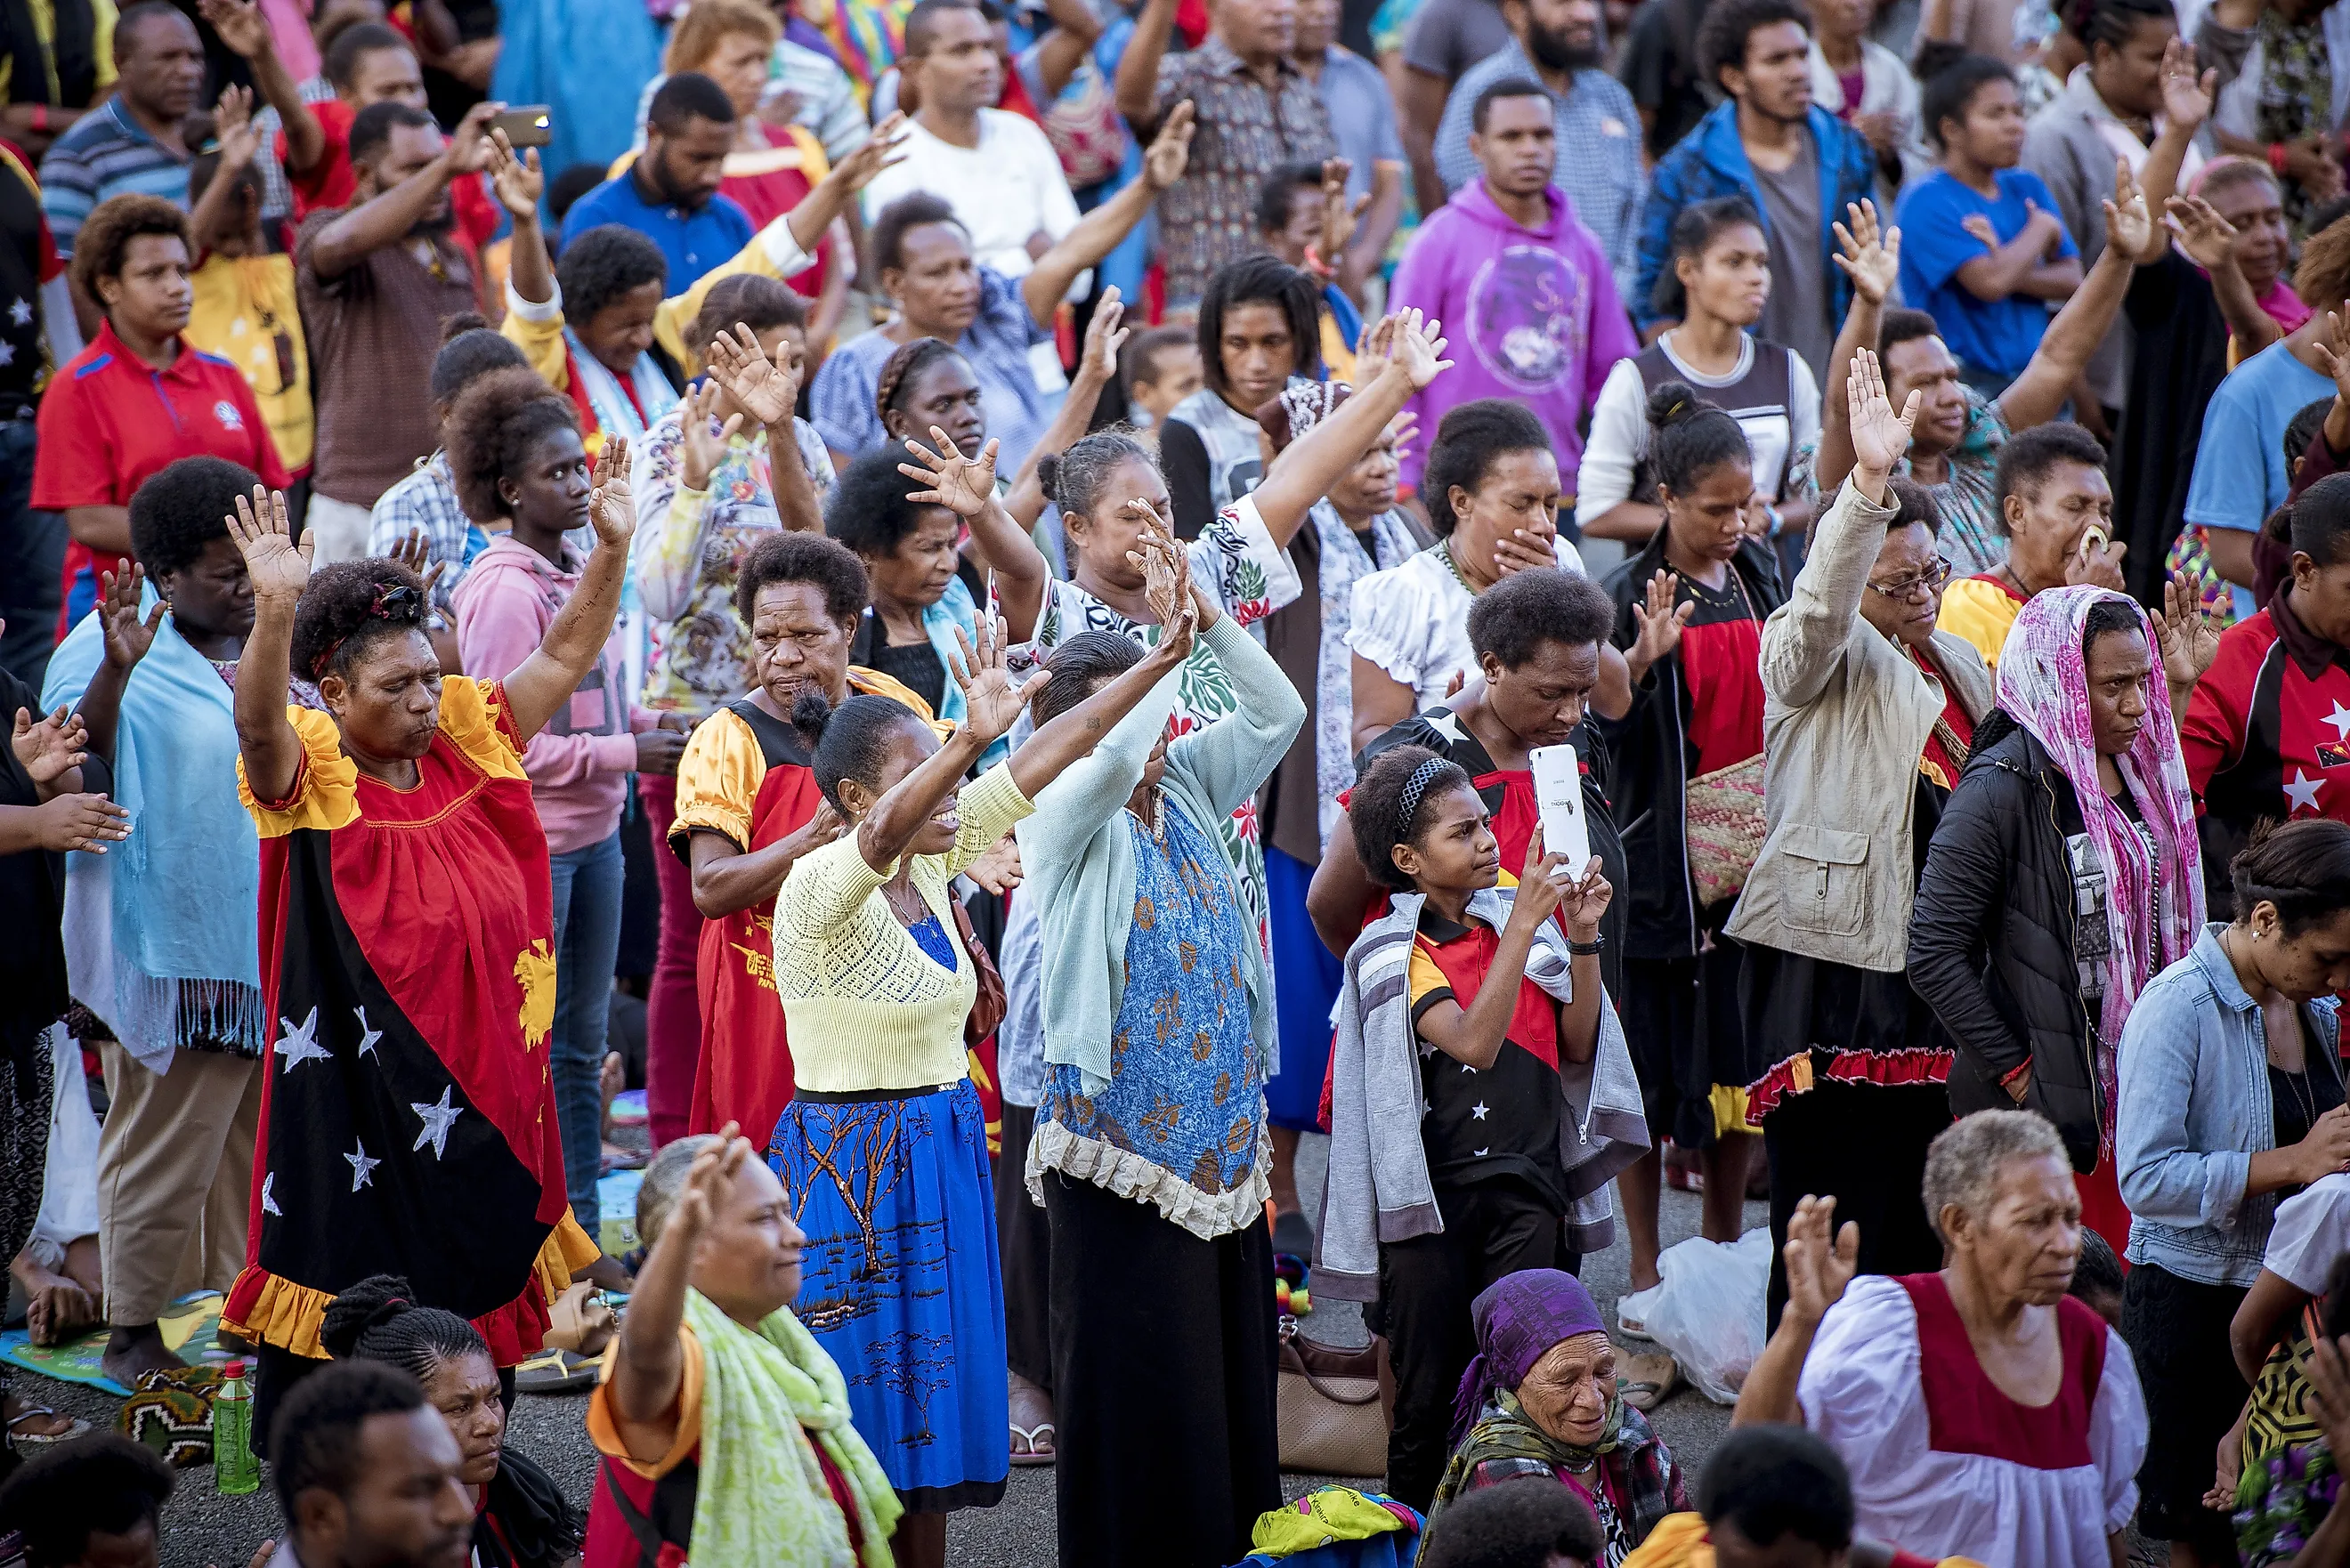
Papua New Guinea did not just top Fearon's list; it broke it. The country scored a perfect 1.0000 for a startling reason: no single ethnic group is large enough to make up even 1% of the population, so by the study's counting rules it effectively registered as having no dominant groups at all. It is also the most linguistically diverse country on Earth, with more than 800 languages in active use. Some of those languages, spoken by communities living within walking distance of one another, are as unrelated as English is to Mandarin. Mountainous terrain did much of the work, walling off valleys from their neighbors for thousands of years.
2. Tanzania

More than a hundred ethnic groups share Tanzania, a country of roughly 71 million people, and most of them speak their own language at home. What keeps the whole arrangement running smoothly is a shared second language: Swahili, promoted as a national tongue after independence, gives Tanzanians a common ground that has helped the country avoid the ethnic strife seen elsewhere in the region. It is a useful reminder that high diversity on paper does not automatically translate into division on the ground.
3. The Democratic Republic of the Congo

The Democratic Republic of the Congo is home to roughly 110 million people spread across more than 200 ethnic groups speaking upward of 240 languages. French holds the whole thing together as the official language, a legacy of Belgian colonial rule, while four national languages, Lingala, Kikongo, Tshiluba, and Swahili, do the everyday work across different regions. It is one of the most populous countries in Africa, and by some projections it will crack the world's ten largest by the end of the century.
4. Uganda

No single group comes close to a majority in Uganda, a nation of about 51 million. The largest, the Baganda, account for less than a fifth of the population at around 16.9%, followed by the Banyankole at 9.5% and the Basoga at 8.4%. From there the numbers fan out across dozens of smaller groups, none big enough to dominate. That even spread, rather than a single patchwork of two or three rivals, is exactly the kind of distribution that pushes a country toward the top of a fractionalization ranking.
5. Liberia

Liberia, a country of about 5.6 million on the West African coast, rounds out the top five. Indigenous groups make up the overwhelming majority of the population, spread across roughly 28 distinct peoples, each with its own language. Linguists sort those languages into three broad families: the Mande, the Kru, and the Mel. Liberia adds a wrinkle the others do not have, though: it was founded in the nineteenth century in part by freed Black Americans, whose descendants, the Americo-Liberians, formed a distinct settler community layered on top of the indigenous majority.
Why Africa Runs the Table

Look past the top five and a pattern is hard to miss: nearly every country in the upper reaches of Fearon's ranking is African, with Papua New Guinea the lone outsider crashing the party. Cameroon, Togo, South Africa, Madagascar, Gabon, Kenya, and Ghana all cluster near the top. The reason is less about isolation than about lines on a map. Colonial powers drew Africa's borders in European conference rooms with little regard for who actually lived where, boxing hundreds of long-established groups into single states almost overnight. The diversity was always there; the borders simply gathered it into countries.
It is also worth saying that "most diverse" depends entirely on how you measure it. Fearon's index rewards linguistic fragmentation, which lifts African and Pacific nations to the top. Ask instead which countries draw the most immigrants from the widest range of origins, and the list reshuffles completely, with the likes of Canada, Australia, and the United States moving to the front. Diversity is not one thing, and no single number captures all of it.
The Most Ethnically Diverse Countries in the World
The full table below ranks the top 50 by Fearon's ethnic diversity score. A note on reading it: because the data dates to around 2001, three entries, Yugoslavia, the Soviet Union, and pre-partition Sudan, are countries that no longer exist in the form measured. They are left in place to reflect the original study rather than quietly dropped, but each is marked accordingly.
| Rank | Country | Ethnic Diversity Score |
|---|---|---|
| 1 | Papua New Guinea | 1.0000 |
| 2 | Tanzania | 0.9530 |
| 3 | Democratic Republic of the Congo | 0.9330 |
| 4 | Uganda | 0.9300 |
| 5 | Liberia | 0.8990 |
| 6 | Cameroon | 0.8870 |
| 7 | Togo | 0.8830 |
| 8 | South Africa | 0.8800 |
| 9 | Republic of the Congo | 0.8780 |
| 10 | Madagascar | 0.8610 |
| 11 | Gabon | 0.8570 |
| 12 | Kenya | 0.8520 |
| 13 | Ghana | 0.8460 |
| 14 | Malawi | 0.8290 |
| 15 | Guinea-Bissau | 0.8180 |
| 16 | Somalia | 0.8120 |
| 17 | India | 0.8110 |
| 18 | Nigeria | 0.8050 |
| 19 | Yugoslavia (dissolved 1992) | 0.8010 |
| 20 | Central African Republic | 0.7910 |
| 21 | Ivory Coast | 0.7840 |
| 22 | Lebanon | 0.7800 |
| 23 | Chad | 0.7720 |
| 24 | Indonesia | 0.7660 |
| 25 | Mozambique | 0.7650 |
| 26 | Gambia | 0.7640 |
| 27 | Sierra Leone | 0.7640 |
| 28 | Ethiopia | 0.7600 |
| 29 | Angola | 0.7560 |
| 30 | Mali | 0.7540 |
| 31 | Afghanistan | 0.7510 |
| 32 | Bolivia | 0.7430 |
| 33 | United Arab Emirates | 0.7370 |
| 34 | Senegal | 0.7270 |
| 35 | Zambia | 0.7260 |
| 36 | Namibia | 0.7240 |
| 37 | Soviet Union (dissolved 1991) | 0.7110 |
| 38 | Sudan (pre-2011 partition) | 0.7080 |
| 39 | Kuwait | 0.7080 |
| 40 | Burkina Faso | 0.7040 |
| 41 | Bosnia and Herzegovina | 0.6810 |
| 42 | Kyrgyzstan | 0.6790 |
| 43 | Nepal | 0.6770 |
| 44 | Iran | 0.6690 |
| 45 | Guinea | 0.6690 |
| 46 | Kazakhstan | 0.6640 |
| 47 | Colombia | 0.6560 |
| 48 | Ecuador | 0.6550 |
| 49 | Eritrea | 0.6470 |
| 50 | Trinidad and Tobago | 0.6470 |