10 U.S. States With The Highest Unemployment Rates
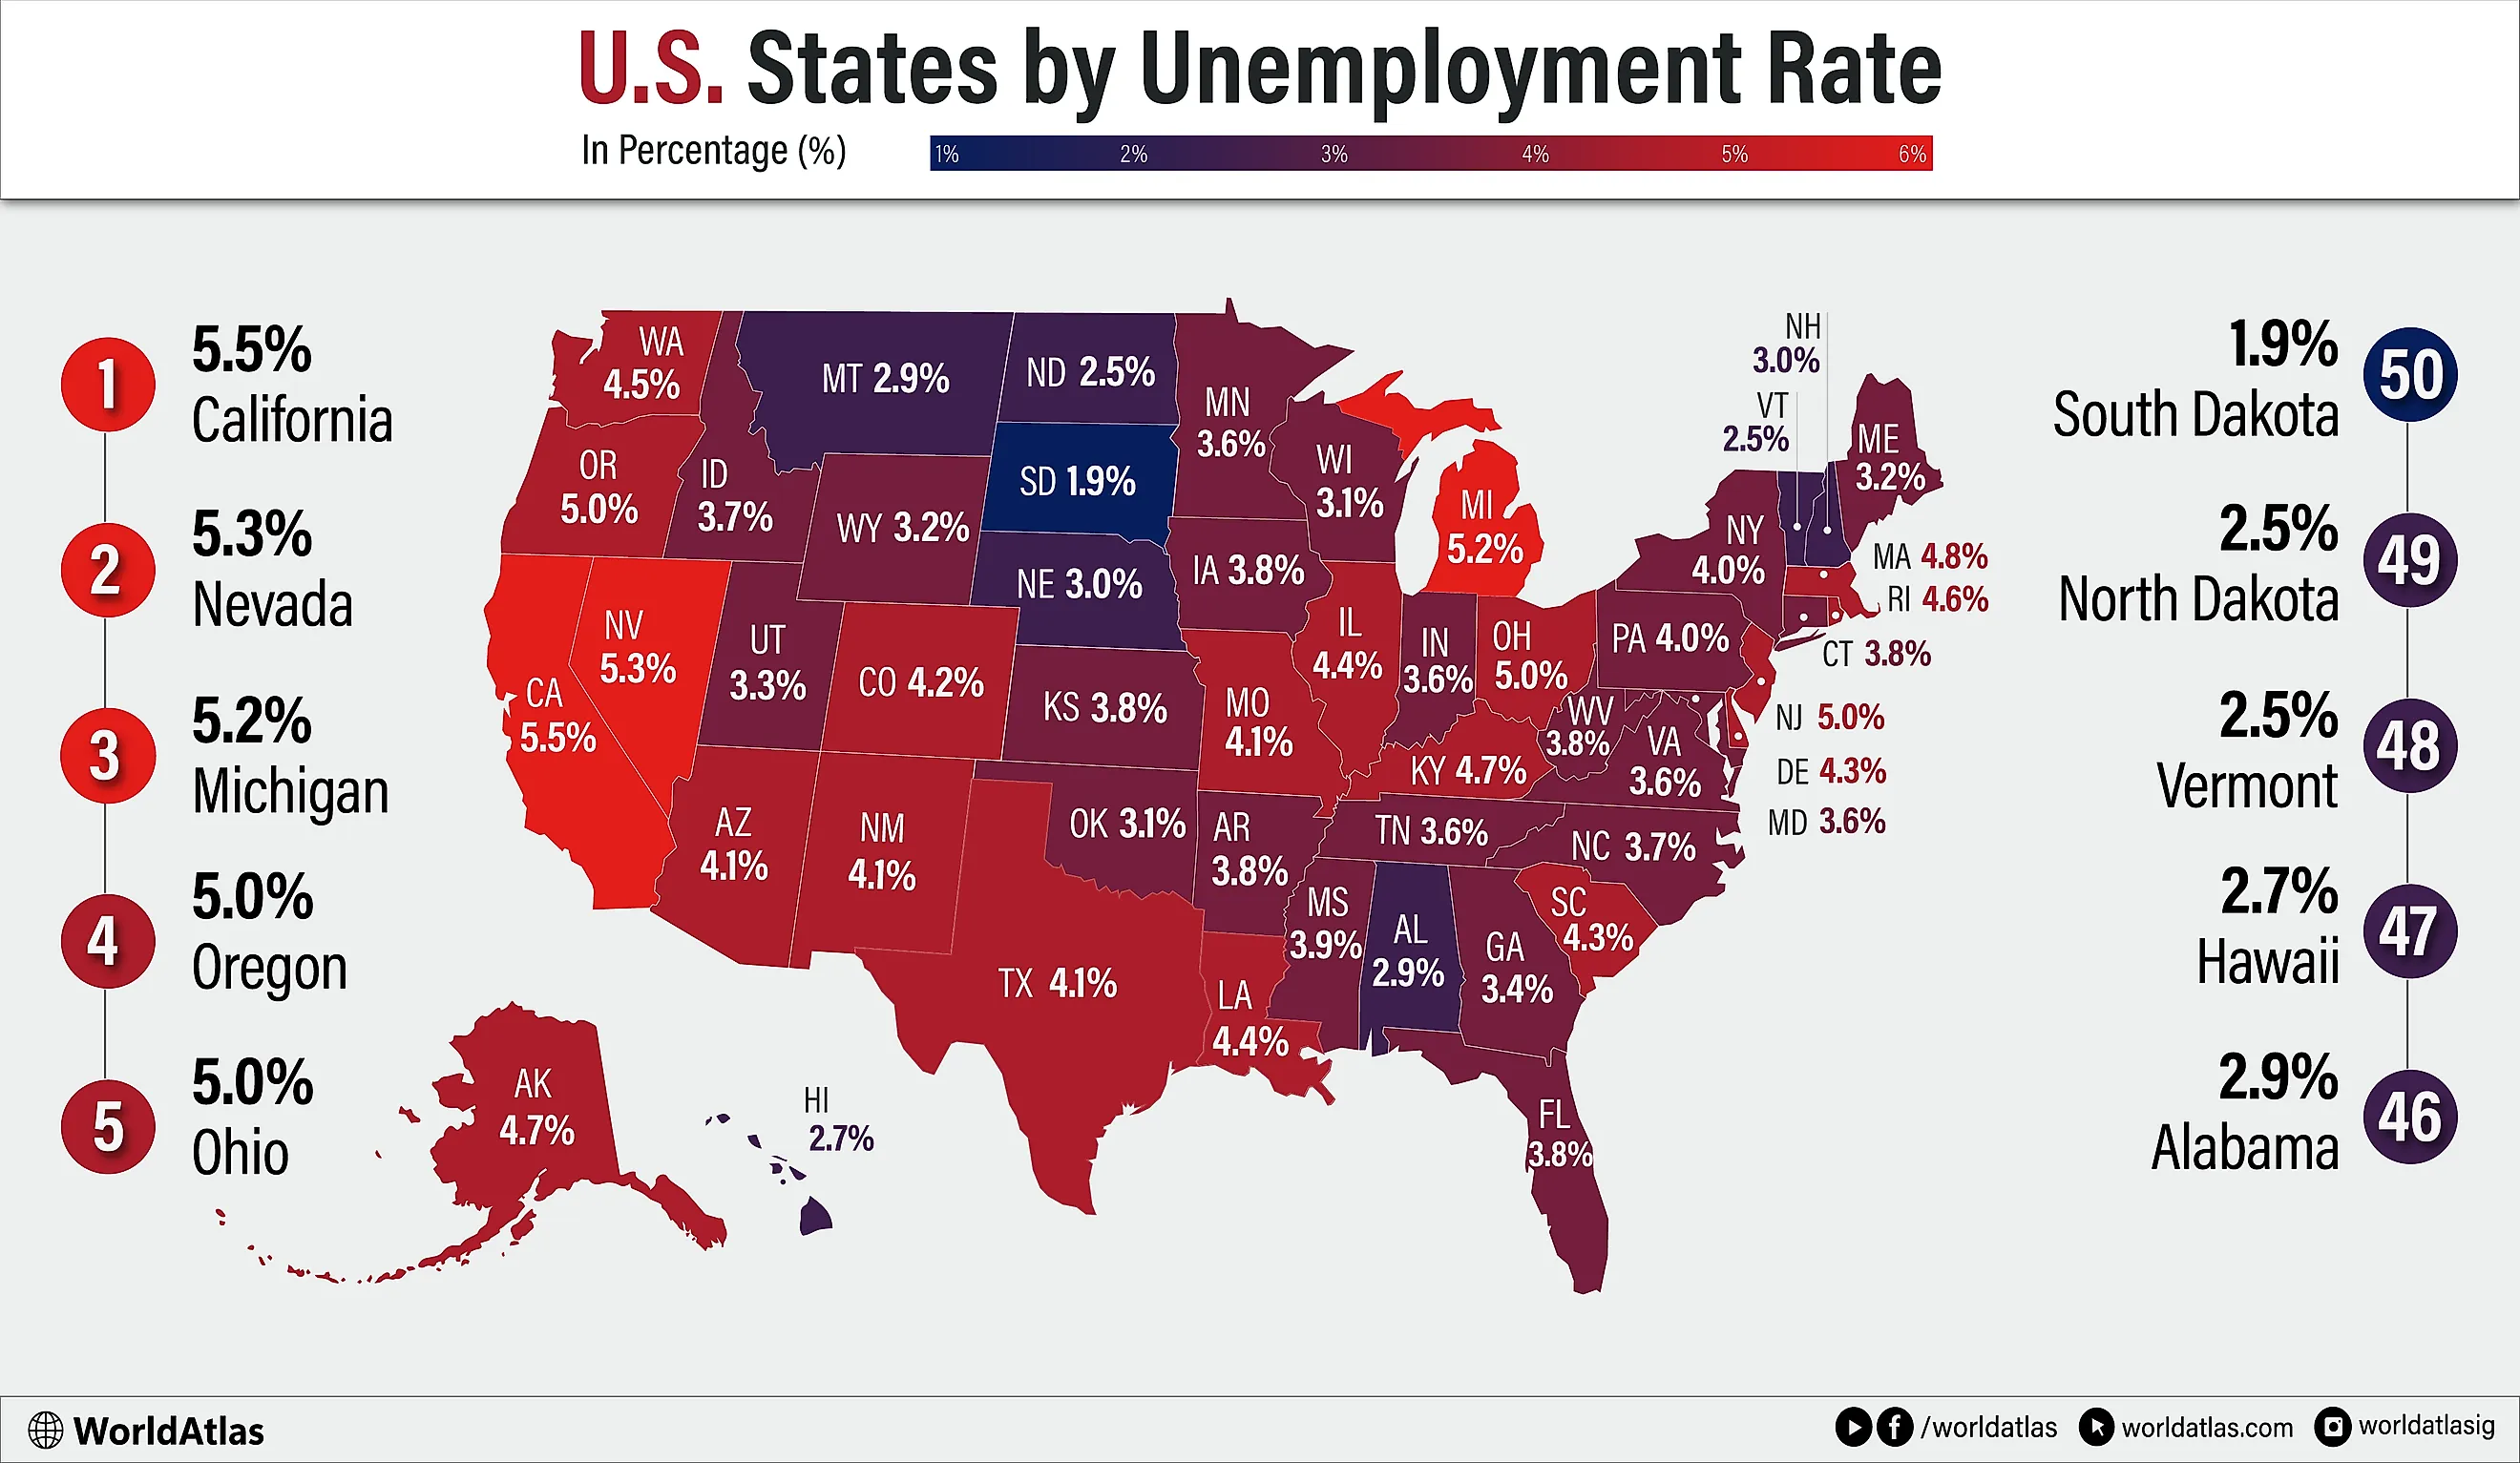
As of August 2025, the highest unemployment rates in the US fall within a narrow range, yet the states behind those figures reveal sharply different pressures on workers and employers. California leads at 5.5%, followed by Nevada at 5.3% and Michigan at 5.2%. New Jersey, Ohio, and Oregon tie at 5.0%, with Massachusetts at 4.8%, Alaska and Kentucky at 4.7%, and Rhode Island tenth at 4.6%.
This top ten has a mix of massive, globalized economies with smaller states whose job markets hinge on a few dominant sectors. California's scale and regional inequality can keep joblessness elevated even when headline growth is strong. Nevada's tourism engine magnifies shifts in travel spending, while Michigan and Ohio carry the aftershocks of industrial restructuring, where automation and retooling can outpace local retraining.
For job seekers and policymakers, each tenth of a point matters. These rates capture more than month-to-month hiring cycles; they reflect cost of living, workforce mobility, and the pace of adaptation to new technologies and evolving consumer demand.
10 U.S. States With The Highest Unemployment Rate
| Rank | State | Unemployment rate |
|---|---|---|
| 1 | California | 5.5% |
| 2 | Nevada | 5.3% |
| 3 | Michigan | 5.2% |
| 4 (tie) | New Jersey | 5.0% |
| 4 (tie) | Ohio | 5.0% |
| 4 (tie) | Oregon | 5.0% |
| 7 | Massachusetts | 4.8% |
| 8 (tie) | Alaska | 4.7% |
| 8 (tie) | Kentucky | 4.7% |
| 10 | Rhode Island | 4.6% |
1. California - 5.5%

California tops the nation with a 5.5% unemployment rate, a reflection of its vast, complex demographics and uneven economic geography. Home to nearly one-ninth of the US population, California now faces a rare period of population decline tied to housing costs, out-migration, and lower birth rates. Major metros like Los Angeles and San Francisco dominate the labor landscape, yet wide regional disparities persist, especially between coastal economies and the agricultural Central Valley. California's extraordinary diversity, where no single racial or ethnic group holds a majority, shapes a multilingual workforce and a dynamic but shifting labor market. Large immigrant communities remain central to key industries, but declining low-skill job opportunities and high living expenses have accelerated departures from the state.
2. Nevada - 5.3%

Nevada posts the nation's second-highest unemployment rate at 5.3%, reflecting the state's unique dependence on tourism and hospitality. Nearly three-quarters of Nevadans live in Clark County, home to Las Vegas, where casinos, entertainment, and services dominate the job market. This concentrated economy creates vulnerability to national downturns, public-health disruptions, and fluctuations in travel spending. While mining, especially gold, remains a major rural employer, most jobs statewide hinge on visitor volume, making Nevada more sensitive to economic shocks than diversified states. After decades of rapid in-migration, Nevada's growth has cooled, adding pressure to a workforce already tied closely to visitor-driven demand. Nevada's highly diverse workforce, shaped by large Hispanic, Asian, and foreign-born communities, remains central to its service industries.
3. Michigan - 5.2%

Michigan's 5.2% unemployment rate, the third highest in the nation, reflects a state still shaped heavily by its industrial legacy and shifting demographic trends. Michigan's population of just over 10 million has grown modestly overall, while many manufacturing-centered cities have continued to shrink. The auto industry remains central to the state's economy, supporting hundreds of thousands of jobs directly and indirectly, yet automation, global competition, and periodic downturns continue to create instability in employment. Michigan's immigrant communities, particularly those from Mexico, India, and the Middle East, play key roles in technology, agriculture, and healthcare, helping diversify the labor force. However, persistent racial and regional disparities, with some cities experiencing steep population loss, weaken labor markets. While Michigan has expanded high-tech, research, and agricultural sectors, and Detroit shows signs of revitalization, the state's uneven recovery and manufacturing exposure help explain its elevated unemployment rate.
4. New Jersey - 5%

With unemployment at 5.0%, New Jersey ties for fourth, and the figure underscores how high costs and sector shifts affect different regions unevenly. At roughly 9.5 million residents, New Jersey's extreme density and high costs sharpen competition for jobs and strain lower-wage households. The state's economy is anchored by pharmaceuticals, biotechnology, finance, logistics, and advanced manufacturing, drawing on one of the most educated workforces in the country. Yet these high-skill sectors do not evenly support all regions, and shifts toward automation, remote work, and corporate consolidation have softened job growth. New Jersey's large immigrant population, one-quarter of all residents, helps sustain growth in technology, healthcare, and services, but disparities between affluent suburban counties and older industrial cities persist. These structural imbalances, combined with slowing population growth in recent years, contribute to New Jersey's elevated unemployment rate.
4. Ohio - 5%

Ohio's 5% unemployment rate reflects the long arc of a state shaped by industrial rise, decline, and ongoing economic transition. Once a national steel powerhouse centered in Cleveland, Youngstown, and Middletown, Ohio built its early growth on ironworks, coal deposits, and major manufacturing innovations. But deindustrialization in the late 20th and early 21st centuries cost the state more than 300,000 manufacturing jobs, reshaping communities across the Rust Belt. Population growth has slowed, and many former industrial cities continue to experience uneven recovery. The Great Recession deepened these challenges, driving unemployment over 11% in 2009 and leaving lasting workforce disruptions. In response, Ohio has pursued diversification, from aerospace and healthcare to clean energy, tech investment, and logistics, leveraging its central location and extensive transportation networks. Yet persistent regional disparities, particularly in Appalachian counties and aging manufacturing corridors, continue to weigh on job creation, helping explain Ohio's elevated unemployment rate today.
4. Oregon - 5%

Oregon ties for fourth at 5.0%, and the ranking points to a split between a dynamic metro economy and slower-growing rural regions. Historically powered by timber, agriculture, and fishing, Oregon remains the nation's top lumber producer, but decades of declining federal harvests and rural mill closures have left many communities with fewer job opportunities. Recent in-migration has softened, leaving rural areas with less momentum, even as Portland's economy remains comparatively resilient. Oregon's economy has diversified into technology, with Intel anchoring the "Silicon Forest," alongside sportswear giant Nike, but these high-skill industries are concentrated in a few counties and do not fully offset slower growth in rural regions. Tourism, bolstered by Oregon's mountains, coastline, and national parks, generates seasonal employment but adds volatility.
7. Massachusetts - 4.8%

Despite its global reputation for education and innovation, Massachusetts records a 4.8% unemployment rate, driven in part by sharp regional divides. Once a manufacturing hub anchored by textiles, shoes, and precision mechanics, the state underwent major deindustrialization in the 20th century, especially in Western Massachusetts after the closure of facilities like the Springfield Armory. Eastern Massachusetts, by contrast, successfully reinvented itself around higher education, biotech, finance, and technology, attracting investment along the Route 128 corridor and producing one of the nation's highest per-capita incomes. Population growth, driven in part by immigration, remains concentrated in Greater Boston, while rural and post-industrial regions experience slower growth and fewer job opportunities. High housing costs limit labor mobility, and sectors like tourism and higher education remain sensitive to economic swings. Despite strong innovation and wealth, these geographic and industry imbalances contribute to Massachusetts' above-average unemployment rate relative to national norms.
8. Alaska - 4.7%

At 4.7%, Alaska's unemployment rate is shaped by distance, seasonality, and heavy reliance on a handful of resource and public-sector employers. With just 740,000 residents spread across an area larger than Texas, California, and Montana combined, Alaska's sparse population and limited road network make jobs highly concentrated in a few sectors. The economy depends heavily on oil production, commercial fishing, tourism, and federal government activity, leaving employment vulnerable to seasonal cycles, global commodity prices, and long-term declines in oil output. Despite a high median household income, many rural communities, especially those off the road system, face limited job opportunities, high living costs, and reliance on subsistence activities. Alaska's workforce is also shaped by its large Native population and seasonal labor patterns in tourism and fishing. While Anchorage supports most economic activity, vast regions experience chronic underemployment, helping explain why this resource-rich but isolated state maintains one of the nation's highest jobless rates.
8. Kentucky - 4.7%

Kentucky posts a 4.7% rate, with strong metro growth offset by persistent job losses and slow recovery in many rural counties. Much of Kentucky's labor market is shaped by its contrasting regions. Urban centers like Louisville and Lexington continue to grow, while many rural counties, especially in the east, face long-term population loss and fewer job opportunities following the decline of coal and traditional manufacturing. The state's climate and significant natural hazards, including frequent flooding and tornado outbreaks, create periodic disruptions for communities and infrastructure. Kentucky's expansive river system and major artificial lakes support tourism and recreation, which contribute seasonal employment but can also introduce volatility. Population growth has slowed, driven largely by modest migration gains and uneven economic development.
10. Rhode Island - 4.6%

Rhode Island's 4.6% unemployment rate places the nation's smallest state tenth on the list, shaped by its dense population, industrial legacy, and persistent regional disparities. Once a center of early American manufacturing, especially textiles and metalwork, Rhode Island still bears the imprint of deindustrialization, as aging mill towns like Pawtucket and Woonsocket continue transitioning toward service-sector economies. Providence anchors the state's population and employment, yet high housing costs and pockets of urban poverty challenge labor stability. Immigration has sustained recent population growth, with large Dominican, Portuguese, Cape Verdean, and Liberian communities contributing to a diverse workforce. Long-term growth remains constrained by modest birth rates and steady out-migration, limiting the state's overall labor-market expansion. Rhode Island's coastal geography supports tourism but also makes the state vulnerable to storms and seasonal job fluctuations.
US States Ranked By Unemployment Rates
| Rank | State | Unemployment rate |
|---|---|---|
| 1 | California | 5.5% |
| 2 | Nevada | 5.3% |
| 3 | Michigan | 5.2% |
| 4 | New Jersey | 5.0% |
| 4 | Ohio | 5.0% |
| 4 | Oregon | 5.0% |
| 5 | Massachusetts | 4.8% |
| 6 | Alaska | 4.7% |
| 6 | Kentucky | 4.7% |
| 7 | Rhode Island | 4.6% |
| 8 | Washington | 4.5% |
| 9 | Illinois | 4.4% |
| 9 | Louisiana | 4.4% |
| 10 | Delaware | 4.3% |
| 10 | South Carolina | 4.3% |
| 11 | Colorado | 4.2% |
| 12 | Arizona | 4.1% |
| 12 | Missouri | 4.1% |
| 12 | New Mexico | 4.1% |
| 12 | Texas | 4.1% |
| 13 | New York | 4.0% |
| 13 | Pennsylvania | 4.0% |
| 14 | Mississippi | 3.9% |
| 15 | Arkansas | 3.8% |
| 15 | Connecticut | 3.8% |
| 15 | Florida | 3.8% |
| 15 | Iowa | 3.8% |
| 15 | Kansas | 3.8% |
| 15 | West Virginia | 3.8% |
| 16 | Idaho | 3.7% |
| 16 | North Carolina | 3.7% |
| 17 | Indiana | 3.6% |
| 17 | Maryland | 3.6% |
| 17 | Minnesota | 3.6% |
| 17 | Tennessee | 3.6% |
| 17 | Virginia | 3.6% |
| 18 | Georgia | 3.4% |
| 19 | Utah | 3.3% |
| 20 | Maine | 3.2% |
| 20 | Wyoming | 3.2% |
| 21 | Oklahoma | 3.1% |
| 21 | Wisconsin | 3.1% |
| 22 | Nebraska | 3.0% |
| 22 | New Hampshire | 3.0% |
| 23 | Alabama | 2.9% |
| 23 | Montana | 2.9% |
| 24 | Hawaii | 2.7% |
| 25 | North Dakota | 2.5% |
| 25 | Vermont | 2.5% |
| 26 | South Dakota | 1.9% |
Source: BLS State Data - August 2025