The Fastest-Rising Lake Levels in North America
Lake levels can increase over very different timescales. Some rise gradually over decades as precipitation, runoff, evaporation, and basin storage shift, while others jump within weeks or months during floods, intense snowmelt, or exceptionally wet seasons. Satellite altimetry from 1992 to 2019 identified several northern Canadian lakes with statistically significant long-term upward trends, while gauge records document much larger short-term increases elsewhere in North America. Because those measurements describe different hydrological processes, the lakes below are divided into comparable multi-decade trends and exceptional rapid rises, with the measurement period stated alongside each figure.
Fastest Long-Term Rising Lake Levels, 1992-2019
These 10 lakes come from the same satellite-altimetry study and can be compared directly. Each figure represents the average annual change in water-surface elevation over the same 27-year period, and each increase was statistically significant. The measurements describe persistent movement in average lake level, not individual floods or isolated wet years.
Yathkyed Lake, Nunavut - 5.5 cm per year

At Yathkyed Lake, the standout figure is not a single flood peak but a 27-year trend. Satellite measurements covering 1992 through 2019 produced an average increase of about 5.5 centimeters per year, among the strongest clearly identified upward trends for natural North American lakes in the study. Removing shorter-term climate variability reduced the estimate only slightly, to 4.8 centimeters per year. The lake occupies the tundra interior of Nunavut, where winter snow is stored for months before being released during a short thaw season. Streams and wetlands across the surrounding basin feed that pulse into the lake, while evaporation is limited by the long period of ice cover. Sustaining a rise of this magnitude across nearly three decades implies a persistent change in the basin's overall water balance.
Doré Lake, Saskatchewan - 4.9 cm per year

Northern Saskatchewan's Doré Lake sits within the boreal forest and ultimately drains toward the Churchill River system. Between 1992 and 2019, its surface elevation increased by roughly 4.9 centimeters per year. The climate-adjusted estimate was 4.8 centimeters, showing that the statistical trend remained almost intact after shorter fluctuations were removed. A concentrated spring pulse from melting snow across the forested catchment enters the lake, followed later in the year by summer rainfall and evaporation that shift levels. Because the lake is not operated as a major storage reservoir, its elevation is less directly shaped by controlled releases than many large managed water bodies. The consistency between the raw and adjusted trends is one of the strongest features of the Doré Lake record.
Lake Winnipegosis, Manitoba - 4.7 cm per year

Broad, shallow, and surrounded by low-relief terrain, Lake Winnipegosis can translate relatively small vertical changes into noticeable shoreline movement. Satellite analysis found an average rise of about 4.7 centimeters per year from 1992 to 2019, with the climate-adjusted rate increasing slightly to 4.9 centimeters. Water reaches the lake through an extensive network of rivers, wetlands, and smaller basins across central Manitoba, so its level reflects conditions far beyond the immediate shoreline. Snowmelt, rainfall, and runoff determine the amount entering the system, while evaporation and downstream drainage remove water. Its shallow geometry matters because additional water can spread laterally across extensive marginal areas instead of being confined within a steep-sided basin.
Carey Lake, Northwest Territories - 4.2 cm per year

Carey Lake in the Northwest Territories recorded an average water-level increase of about 4.2 centimeters per year between 1992 and 2019. The climate-adjusted trend was also 4.2 centimeters per year, giving it one of the clearest statistically significant increases in the satellite dataset. The study places the lake at roughly 62.2° N, 102.82° W, while Canada's official geographical-name record locates Carey Lake nearby at about 62.2003° N, 103.0006° W. Geological Survey of Canada mapping likewise identifies Carey Lake in this part of the Northwest Territories. The official location matters because the lake lies close enough to Nunavut for its territory to be easily misidentified in secondary material.
Dubawnt Lake, Nunavut - 4.1 cm per year

Covering thousands of square kilometers, Dubawnt Lake requires a very large additional volume of water to raise its average surface by even a few centimeters. Satellite data show an increase of about 4.1 centimeters per year from 1992 through 2019, while the climate-adjusted trend reached 4.2 centimeters. The surrounding tundra basin feeds the Dubawnt River, which carries water north toward Baker Lake and ultimately Hudson Bay. Snow accumulated over a huge drainage area contributes heavily to spring and summer inflow. Spread across the lake's vast surface, the measured elevation gain represents a substantial increase in freshwater storage rather than a small localized shoreline fluctuation.
Kasba Lake, Northwest Territories and Nunavut - 3.5 cm per year

Kasba Lake lies near the headwaters of the Kazan River in a sparsely populated landscape of exposed Canadian Shield, tundra, and interconnected waterways. Its measured level increased by about 3.5 centimeters per year between 1992 and 2019. After adjustment for shorter-term climatic variability, the trend remained close at 3.4 centimeters. Snow accumulated during the long winter becomes a major source of runoff once temperatures rise, sending water through numerous streams toward the lake. The basin contains little large-scale development capable of directly controlling its surface elevation, unlike lakes where dams, diversions, or reservoir operations can materially alter the measured trend.
Talbot Lake, Yukon - 3.3 cm per year

Repeated satellite passes provide much of the evidence for Talbot Lake's elevation trend. From 1992 through 2019, the lake gained approximately 3.3 centimeters per year, while the climate-adjusted rate was 3.2 centimeters. The record shows why satellite altimetry is particularly useful in northern Canada, where maintaining continuous shoreline gauges across remote terrain can be difficult. Each elevation measurement captures the outcome of water entering through precipitation, runoff, and groundwater against losses through evaporation and drainage. For a significant upward trend to persist across a 27-year record, years with net water gains must have been strong or frequent enough to shift the long-term elevation rather than simply produce temporary seasonal peaks.
Amadjuak Lake, Nunavut - 3.0 cm per year

On southern Baffin Island, Amadjuak Lake spends much of the year beneath ice. Satellite measurements show that its average elevation increased by about 3.0 centimeters per year from 1992 to 2019, with a climate-adjusted estimate of 3.1 centimeters. Winter precipitation is stored across the surrounding Arctic landscape as snow before spring and summer thaw sends meltwater through streams and wetlands into the basin. Later-season rainfall contributes additional inflow before freeze-up returns. Amadjuak also drains through a broader network toward Hudson Strait, so its water level responds to hydrological conditions across the catchment and not simply to precipitation falling directly on the lake.
Baker Lake, Nunavut - 2.9 cm per year

Baker Lake occupies the lower end of an enormous drainage network. The Thelon and Kazan rivers carry runoff from deep inside the Canadian mainland before reaching the lake and continuing toward Chesterfield Inlet. Satellite measurements indicate that Baker Lake rose by about 2.9 centimeters per year between 1992 and 2019, with an adjusted trend of 3.0 centimeters. Precipitation and snowmelt occurring hundreds of kilometers upstream can therefore affect its elevation after moving through the river system. Changes in discharge from the Thelon and Kazan are consequently central to Baker Lake's water balance, making its level a regional signal rather than a record of strictly local weather.
Great Bear Lake, Northwest Territories - 2.8 cm per year

Great Bear Lake covers more than 31,000 square kilometers, so even a centimeter of additional elevation represents an enormous volume of stored freshwater. The 1992-2019 satellite analysis measured an average increase of about 2.8 centimeters per year, while the climate-adjusted trend remained close at 2.7 centimeters. The lake receives runoff from a vast subarctic catchment and drains west through the Great Bear River into the Mackenzie River system. Ice covers the surface for much of the year, suppressing evaporation through winter before the spring and summer thaw delivers the main runoff pulse. Its immense area makes the measured multi-decade increase volumetrically significant despite the smaller annual rate compared with Yathkyed or Doré.
Largest Rapid Lake-Level Rises
The next nine cases are not positions 11 through 19 in the long-term ranking. They document exceptionally large increases over specific intervals ranging from 51 days to 18 years, using gauge records and other lake-level observations rather than the common 1992-2019 trend calculation above. Their figures therefore measure meters gained during individual hydrologic episodes associated with sustained wet periods, concentrated snowmelt, extreme rainfall, hurricanes, or recovery from unusually low levels.
Devils Lake, North Dakota - 9.7 m from 1993 to 2011

Devils Lake climbed from roughly 1,422.6 feet in 1993 to a record 1,454.4 feet in June 2011, a gain of 31.8 feet, or about 9.7 meters. Its area expanded from approximately 44,000 acres to more than 211,000 acres during the prolonged wet period. The North Dakota lake occupies a closed basin that normally lacks a dependable outlet, so excess precipitation and watershed runoff cannot simply continue downstream. Repeated wet years instead allowed water to accumulate across the basin. The advancing shoreline inundated agricultural land and forced costly changes to highways, rail infrastructure, and other development around the lake as areas that had remained dry for decades disappeared beneath rising water.
Kootenay Lake, British Columbia - 3.96 m in 51 days

Only 51 days separated Kootenay Lake's level of about 529.93 meters on April 24, 2022, from 533.89 meters on June 14. The 3.96-meter increase averages roughly 7.8 centimeters per day across the interval. A substantial mountain snowpack remained in place during a cool spring that initially delayed melting, then warmer conditions accelerated runoff into the lake. Peak inflows reached several thousand cubic meters per second as water descended from the surrounding mountain watershed. Kootenay is regulated, meaning operators also influence outflow, but the speed of the 2022 rise was driven by an unusually concentrated freshet delivering an exceptional volume of meltwater in a matter of weeks.
Lake Chapala, Mexico - 2.44 m in 2018

Lake Chapala began its 2018 seasonal recovery in June and had gained approximately 2.44 meters by its late-November maximum. Mexico's largest freshwater lake receives much of its inflow from the Lerma River, whose watershed crosses major urban areas, irrigated farmland, and numerous reservoirs in central Mexico. Chapala is shallow, so a rise measured in meters can push its shoreline outward across broad low-gradient areas. The 2018 increase was substantial but not unprecedented: Mexican authorities reported a recovery of about 3.25 meters in 2003. How much rainfall ultimately reaches the lake also depends on upstream storage and withdrawals throughout the heavily used Lerma-Chapala basin.
Namakan Lake, Ontario and Minnesota - About 2.5 m in 2022

Namakan Lake entered the end of March 2022 near a managed range of 339.65 to 339.80 meters before climbing to approximately 342.18 meters, placing the increase at roughly 2.4 to 2.5 meters. April and May brought around 257 millimeters of precipitation to the Rainy River basin, more than twice the normal amount for those months. Melting snow simultaneously added water to catchments already receiving heavy rainfall. Inflows into the interconnected Namakan-Rainy system reached record levels for the period, pushing Namakan to its third-highest recorded elevation and leaving the lake only a few centimeters below its historic 1916 maximum.
Rainy Lake, Ontario and Minnesota - About 2.4 m in 2022

Farther downstream in the same watershed, Rainy Lake climbed from an early-spring operating range near 337 meters to approximately 339.31 meters. The 2022 peak surpassed the previous record established in 1950. Heavy April and May precipitation coincided with snowmelt throughout the basin, while additional water arrived through upstream rivers, wetlands, and Namakan Lake. Operators were releasing water through the lake's control structures, but downstream capacity limited how quickly the incoming volume could be removed. Shoreline flooding persisted around communities on both sides of the Ontario-Minnesota border while the basin processed one of its most extreme recorded spring inflow events.
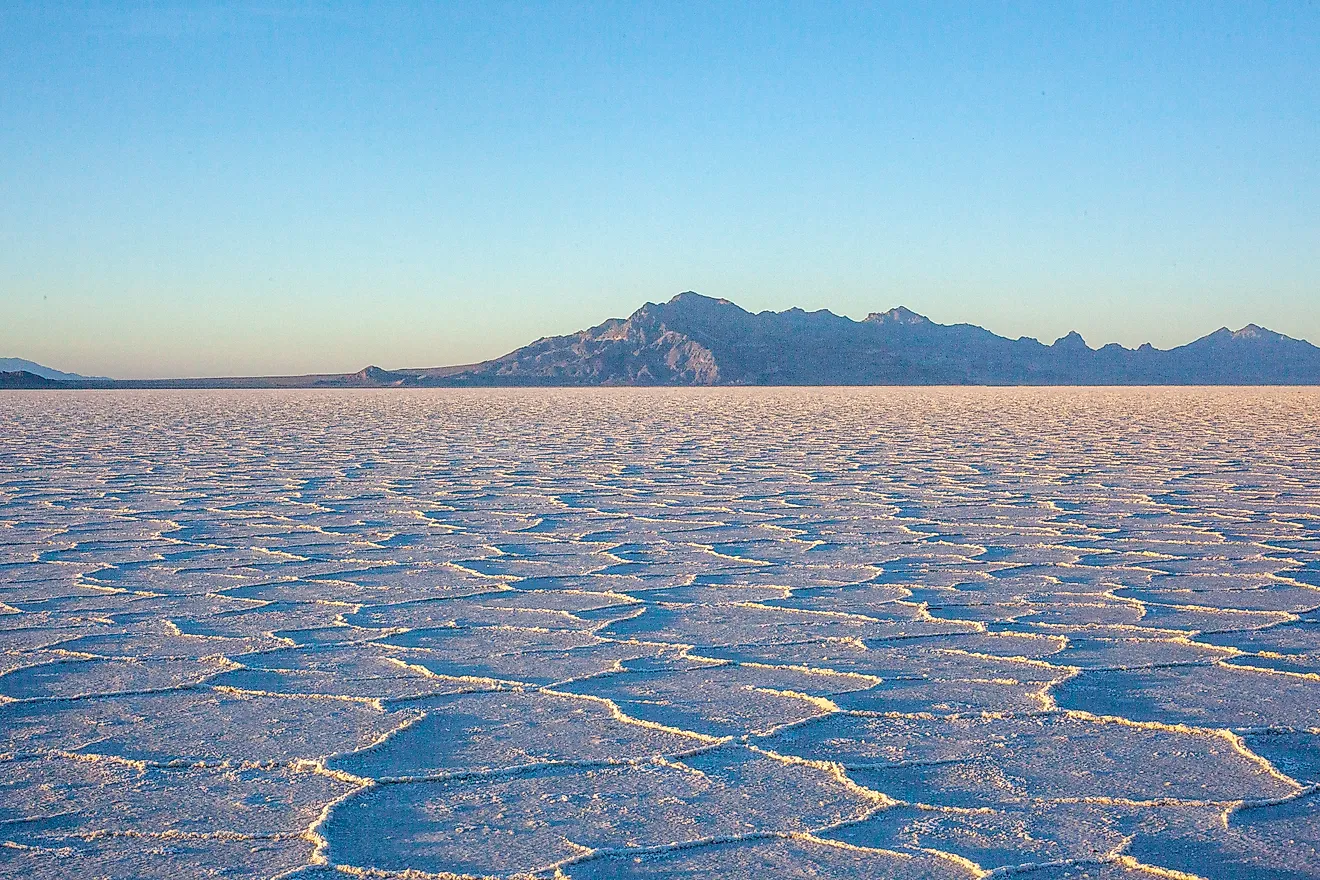
Great Salt Lake, Utah - 1.98 m from 2022 to 2024

After Great Salt Lake reached a record low in November 2022, two snow-heavy winters lifted its surface by about 6.5 feet, or 1.98 meters, by May 2024. Mountain runoff increased flows through the Bear, Weber, and Jordan river systems, which provide most of the freshwater entering the lake. Because Great Salt Lake has no river outlet, water remains in the terminal basin until it evaporates. The rebound covered areas of recently exposed lakebed and increased the lake's volume substantially, but the surface still remained below elevations associated with healthier wetlands and salinity conditions. The nearly two-meter gain therefore recovered only part of the water lost during the preceding decline.
Lake Okeechobee, Florida - 1.91 m in 2017

Lake Okeechobee stood near 10.93 feet on June 1, 2017, and reached 17.2 feet by October 9, an increase of about 6.27 feet, or 1.91 meters. Hurricane Irma accelerated the rise after crossing Florida in September and sending intense rainfall across the lake's broad watershed. More than three feet of the total increase occurred around the period following the storm. Okeechobee is extremely shallow for its surface area, so higher water levels increase pressure on the Herbert Hoover Dike and leave managers with larger volumes to move through the regional canal system. Those emergency and regulatory releases can carry freshwater and nutrients toward estuaries on Florida's Atlantic and Gulf coasts.
Mono Lake, California - 1.37 m in one year

Between October 2022 and October 2023, Mono Lake gained about 4.5 feet, or 1.37 meters, following an exceptionally snowy winter in the Sierra Nevada. Mountain streams carried prolonged snowmelt into the terminal basin through spring and summer. Mono Lake has no natural outlet, leaving evaporation as its principal water loss, while diversions from tributaries have also shaped its modern elevation. Those diversions drove substantial twentieth-century declines before court-ordered restrictions reduced exports. The 2023 runoff pulse submerged recently exposed shoreline and increased lake volume, although the surface remained below the long-term restoration elevation established for the Mono Basin ecosystem.
Lakes Michigan-Huron - 0.96 m from 2013 to 2014

Lake Michigan and Lake Huron gained approximately 0.96 meters between 2013 and 2014 after exceptionally low levels early in 2013. The Straits of Mackinac allow water to move freely between the two lakes, keeping their surfaces at essentially the same elevation and making them one hydrological system for water-level analysis. Wetter conditions increased inflow while cooler conditions reduced evaporation, reversing the losses that had dominated the preceding years. The rebound continued into a period of much higher Great Lakes levels later in the decade. Across the full 1992-2019 satellite record, however, neither Michigan nor Huron showed a statistically significant long-term upward trend, separating this rapid rebound from the persistent rises in the first section.