The Counties That Flood The Most
The county that floods most often in America is not on a coast or a great river. It is a stretch of Southern California desert and mountains. FEMA's National Risk Index counts how often inland-flood conditions recur, drawn from the historical record rather than a forecast, and the result scrambles expectations: arid counties in Arizona, Nevada, and California crowd the top of the list alongside river country in Pennsylvania, Texas, and southern Illinois. The 12 counties below run in descending order of that frequency. The figure counts events, not coastal flooding, insurance claims, disaster declarations, or dollar losses, which is why one number can describe a dry Tucson wash and the meeting of the Ohio and Mississippi alike.
1. San Bernardino County, California: 12.96 Flood Events Per Year

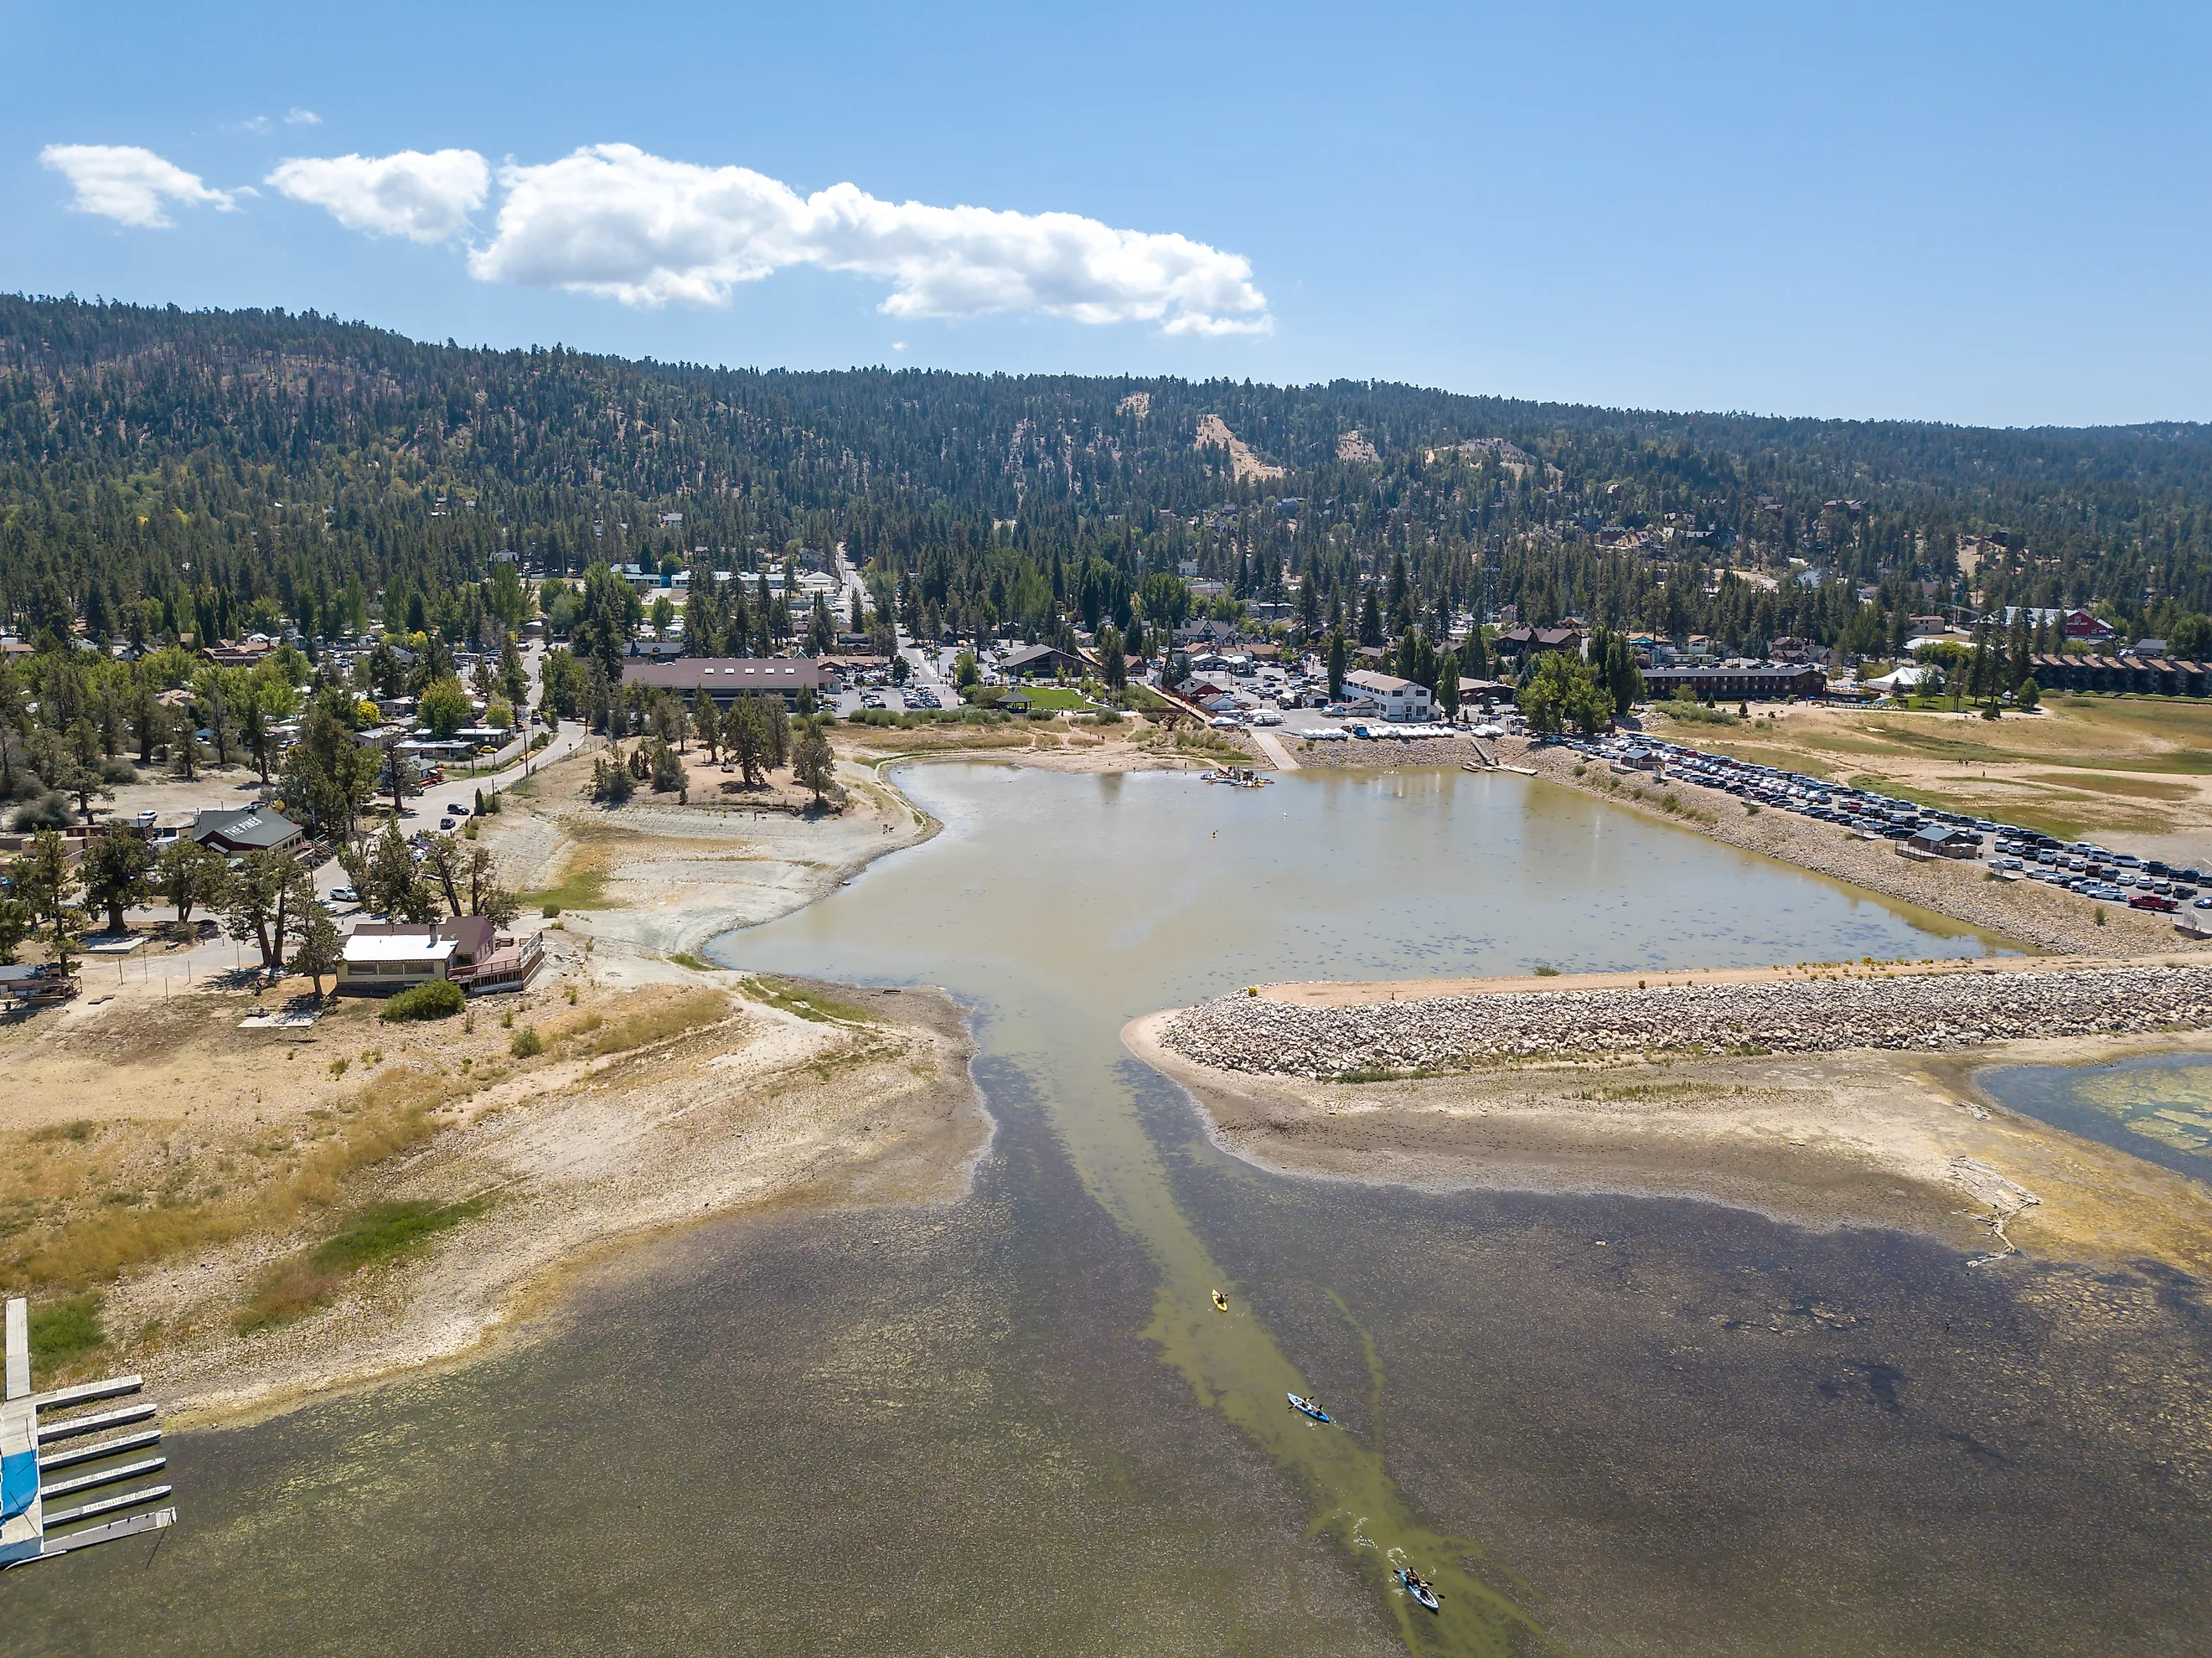
A drive across San Bernardino County can move from suburban valleys into the San Bernardino Mountains and then out across the Mojave Desert, and each landscape creates a different flood problem. FEMA's annualized inland-flood frequency reaches 12.96 here, the highest figure in this group. County planning material recognizes alluvial-fan, riverine, and urban flooding, while the regional flood-control system includes dams, basins, channels, and storm drains built to move runoff away from developed areas.
There is a second hazard along the mountain front. County emergency guidance warns that intense rain can trigger flash floods and debris flows, especially where steep slopes funnel water, mud, rocks, and burned vegetation downhill. San Bernardino's flood-control history includes destructive debris flows in Waterman and Cable canyons, and in one major episode 33 of 34 foothill debris basins filled with rocks, trees, and mud. Flood frequency here reflects both desert runoff and the violent response of mountain watersheds.
2. Pima County, Arizona: 12.82 Flood Events Per Year

Pima County sits just behind San Bernardino at 12.82 annualized inland-flood events, a number that makes much more sense once Tucson's network of washes and arroyos comes into view. County flood-safety guidance explains that mountainous terrain and relatively impervious soils can prevent rainfall from soaking in quickly, sending runoff through normally dry channels during and after severe storms. Summer monsoon thunderstorms are especially important because short, intense downpours can push water across roads, underpasses, low ground, and wash crossings. Flooding is not confined to summer. Long winter storms can also generate dangerous flows, and flash floods may arrive far downstream from the rain that produced them. Steep terrain, hard ground, and two distinct storm seasons help explain why such an arid county can rank near the top nationally.
3. Mohave County, Arizona: 10.43 Flood Events Per Year

The open desert around Kingman, Lake Havasu, and the Colorado River can look almost too dry to belong on a flood ranking. FEMA-derived data put Mohave County at 10.43 inland-flood events per year, while the county's own Flood Control District describes severe rainfall as a recurring trigger for flash flooding across its mountain-and-desert terrain.
Water does not have to fall directly overhead. Storms can fill washes and rivers elsewhere and send runoff through connected tributaries, while a short cloudburst can exceed the ground's ability to absorb water. Roads, parking areas, and buildings also interrupt natural drainage in developed communities.
Kingman offers a concrete example. Mohave Wash historically flooded residential and commercial areas, leading to an $11.7 million channel project completed in 2006. The redesigned channel was built for a 15,000-cubic-foot-per-second 100-year flow and helped remove roughly 650 homes from FEMA Special Flood Hazard Areas.
4. Maricopa County, Arizona: 8.46 Flood Events Per Year

Phoenix is famous for heat and cloudless skies, but Maricopa County's 8.46 annualized inland-flood events show the other side of Sonoran Desert weather. The county Flood Control District identifies summer monsoon storms and winter rainstorms as its two main flood-producing seasons. During the monsoon, brief downpours can send runoff down a widespread network of normally dry washes and riverbeds. To track those storms, the district maintains hundreds of automated precipitation gauges in and around the county.
Local monsoon guidance warns that normally dry washes can become flash-flood channels and that low-water crossings may turn impassable. Parks and recreation areas can also function as basins or parts of the drainage network. For visitors, a sandy wash beside a trail or desert road can look completely harmless until a thunderstorm higher in the watershed sends water through it within minutes.
5. Coconino County, Arizona: 8.04 Flood Events Per Year

Coconino County's 8.04 annualized inland-flood events are tied to a landscape where monsoon rainfall meets steep volcanic terrain and wildfire scars. Around Flagstaff and the San Francisco Peaks, recent fires have changed how quickly water leaves slopes. After the 2022 Pipeline and Tunnel fires, local officials mapped post-fire flood corridors and modeled intense storms over burned watersheds. In 2024, the county completed major work in the Copeland Flood Corridor, combining about 52 acres of watershed restoration with nearly 9,000 feet of buried storm-drain pipe and capacity for roughly 2,000 cubic feet of water per second. The problem remains active. In July 2026, rain gauges in the Schultz and Pipeline burn scars generated more than 150 threshold alerts during one evening, with one gauge recording 3.89 inches of rainfall.
6. San Diego County, California: 7.89 Flood Events Per Year

San Diego County is known for its beaches, but its inland terrain does much to explain the 7.89 annualized inland-flood events recorded here. County Public Works identifies seven principal watersheds that originate in or cross the county, including the Santa Margarita, San Luis Rey, San Dieguito, San Diego, Sweetwater, Otay, and Tijuana river systems. Local records also document major flooding in places such as Mission Valley, El Cajon, Ramona, and Borrego Springs after intense or prolonged rain.
The sharpest contrast appears east of the coast. Central and eastern districts are especially susceptible to flash flooding because mountain canyons, dry creek beds, and high desert dominate the terrain. Borrego Valley is subject to alluvial-fan flooding, where shifting flows pose another engineering challenge. Flooding can also occur in low spots away from mapped waterways when rainfall simply overwhelms local drainage.
7. Bexar County, Texas: 7.46 Flood Events Per Year

Bexar County's 7.46 annualized inland-flood events place San Antonio's home county among the highest-frequency entries in the FEMA-derived ranking. County wet-weather guidance describes flash flooding as a recurring hazard and uses High-Water Alert Lifesaving Technology at flood-prone crossings. Sensors detect rising water and activate warning lights or gates before drivers enter dangerous sections of road.
Officials installed that system because of the way water moves across the region's creeks, drainage channels, dips, and low-water crossings. Local emergency material notes that flash floods can develop within minutes or hours after excessive rainfall, while overland flooding may occur when waterways overflow or when rainfall exceeds the capacity of streets, pipes, and drains.
Outside central San Antonio, roads repeatedly cross shallow drainage channels and creek bottoms that may appear unremarkable in settled weather. Once a strong thunderstorm reaches the watershed, those same crossings can sit directly in the path of fast-moving runoff.
8. Riverside County, California: 7.36 Flood Events Per Year

Riverside County spans a remarkable cross-section of Southern California, reaching from the wetter western valleys toward Palm Springs and the desert beyond. Its 7.36 annualized inland-flood events fit a place where flood behavior changes with the terrain. The Riverside County Flood Control and Water Conservation District regulates riverine floodplains, shallow ponding zones, sheet-flow areas, and alluvial-fan hazards. In some mapped areas, floodwater can spread across sloping ground at average depths of one to three feet. The county's modern flood-control program dates to the destructive floods of 1938, and the district now maintains more than 1,000 miles of storm drains, channels, and levees along with numerous basins and dams. Those works have reduced large-scale damage, but local guidance still warns that flash floods can develop with little notice in mountainous terrain.
9. Allegheny County, Pennsylvania: 7.32 Flood Events Per Year

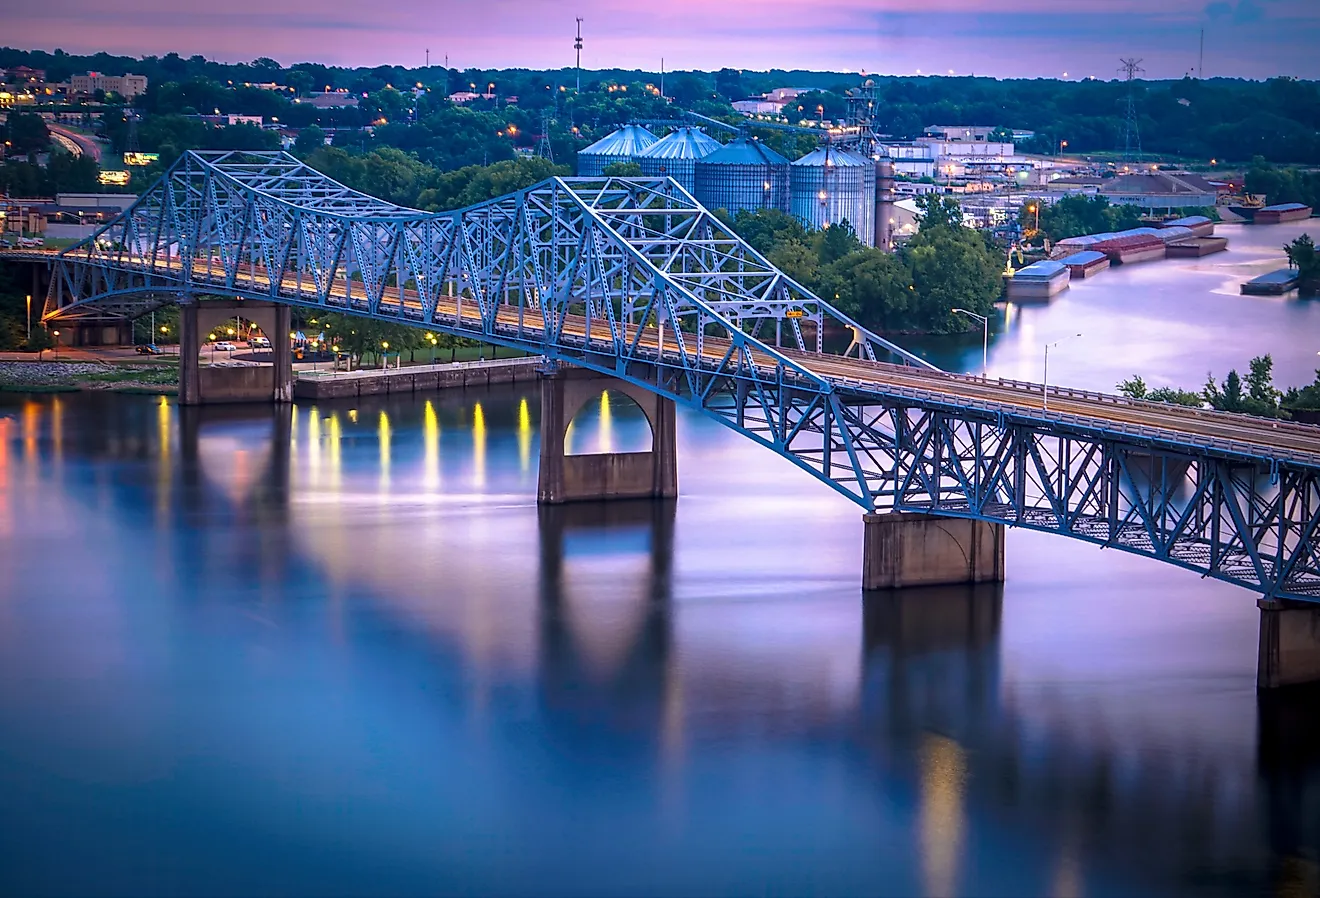
Allegheny County is where the scenery changes completely. Instead of desert washes, Pittsburgh sits where the Allegheny and Monongahela meet to form the Ohio, while smaller streams cut through steep valleys around the county. FEMA-derived frequency reaches 7.32 inland-flood events per year. County community profiles identify mapped floodplain along all three major rivers, including areas in Tarentum, West Elizabeth, and Haysville.
In that geography, development stands close to water in many places. From Pittsburgh's hills, the arrangement is easy to see: roads, homes, old industrial districts, and compact boroughs often occupy narrow bottoms below wooded slopes. Heavy rain can reach tributaries quickly, while prolonged wet periods can raise the three larger rivers. The 7.32 figure does not measure damage, but it captures how frequently inland-flood conditions recur across this tightly folded river landscape.
10. Clark County, Nevada: 7.25 Flood Events Per Year

Las Vegas may be built around neon and desert sun, yet Clark County shows 7.25 annualized inland-flood events in the FEMA-derived data. Regional flood-control officials identify July through September as the main flash-flood season while emphasizing that flooding can occur at any time of year. The county's Flood Threat Recognition System uses nearly 350 meteorological sensors, with most stations concentrated in the Las Vegas Valley and additional gauges serving communities such as Laughlin, Mesquite, Moapa Valley, Searchlight, and Indian Springs. That monitoring network exists because of a basic desert problem. Intense thunderstorms can unload heavy rain over a small watershed, then send runoff racing toward lower ground through channels and developed areas that may have been completely dry only minutes earlier.
10. Yavapai County, Arizona: 7.25 Flood Events Per Year

Yavapai County ties Clark County at 7.25 annualized inland-flood events, but its flood geography is more varied than a simple desert label suggests. County flood-control material describes riverine, sheet, flash, and erosion hazards, with many rivers and washes remaining dry until storms send runoff through them. Flash flooding occurs most often after short, high-intensity summer storms, particularly during the monsoon.
The Verde River, Oak Creek, and Beaver Creek account for a second scale of flooding. These waterways drain large watersheds capable of collecting prolonged rainfall until channels overtop their banks, producing broader floods than a localized thunderstorm.
Recent gauge records show how quickly conditions can change. In September 2024, Granite Creek at Prescott rose more than 6.5 feet in one hour. Flooding around Cornville also affected roads and homes in 2024. Burned terrain is another risk factor, because wildfire can strip vegetation and leave slopes unusually vulnerable to flash floods and mudflows for years afterward.
10. Alexander County, Illinois: 7.25 Flood Events Per Year

At Illinois' southern tip, Alexander County reaches the same 7.25 annualized inland-flood frequency through a completely different hydrologic setting. Cairo occupies the point where the Ohio River joins the Mississippi, placing the county beside two enormous drainage systems. High water arriving through both rivers can converge near the county's southern edge, and generations of levees and other engineering works stand as evidence of how persistent that pressure has been.
The confluence has required large-scale flood protection. The U.S. Army Corps of Engineers describes a roughly 22-mile levee system around Cairo and nearby areas, with an average height of about 25 feet. During the record 2011 flood, the Corps activated the Birds Point-New Madrid Floodway downstream of Cairo. USGS measurements showed that the operation lowered the Ohio River stage near Cairo by almost half a foot within an hour. Major high water returned to the confluence again in April 2025, keeping flood-control crews on alert.
What the Ranking Actually Measures
Grouped together, these twelve counties make one point clearly: high flood frequency has little to do with a county being wet. Nine of the twelve sit in the arid Southwest, where bare ground sheds water almost as fast as it falls and normally dry washes carry the runoff in minutes. The river counties in Pennsylvania and Illinois flood for the opposite reason, as water gathers across enormous drainage basins and rises at the confluences. Because the FEMA figure counts how often inland-flood conditions recur rather than how much damage results, a desert wash in Tucson and the meeting of the Ohio and Mississippi at Cairo can land within a few events of each other. Read that way, the list is less a map of rainfall than a map of how quickly, and how often, water has nowhere to go but across the ground people live on.