10 Most Polluted Cities In The United States
Bakersfield, California, has ranked as the metro area with the worst year-round particle pollution in the United States for seven years running. It is one entry on a list the American Lung Association rebuilds every year in its "State of the Air" report, and the 2026 edition (the 27th) draws on air-quality data covering 2022 through 2024. That report found that 152.3 million people, about 44% of the country, live in counties that earned a failing grade for ozone or particle pollution. The cities below carry the heaviest year-round particle pollution, the fine soot measured as PM2.5 that lingers in the air all year, according to that report. The causes run across farm dust, oil and gas work, diesel traffic, heavy industry, winter wood smoke, and wildfire smoke that now drifts across state and national borders.
Bakersfield-Delano, California

Bakersfield sits at the southern end of California's San Joaquin Valley, a bowl ringed by mountains that traps whatever the region puts into the air. That includes diesel exhaust from farm equipment and freight trucks, dust kicked up off cropland, and emissions from one of the most productive oil and gas fields in the country. Cool air settling into the valley in winter forms temperature inversions that cap the pollution close to the ground for days at a time. The metro has held the worst spot for year-round particle pollution for seven consecutive years. It posted its lowest year-round average on record in the 2026 report and improved enough on daily spikes to give up its long-held worst ranking for short-term particle pollution, which now belongs to Fairbanks, Alaska.
Brownsville-Harlingen-Raymondville, Texas

The Brownsville metro, at the southern tip of Texas in the Rio Grande Valley, recorded the steepest worsening of any city on the year-round list. It moved from 16th worst in the previous report to second worst in 2026, its highest year-round particle reading the report has ever recorded for the area. The 2026 report noted that fine-particle levels rose across several southern states even as most of the country improved. The border region also carries pollution that crosses from the densely populated areas on the Mexican side, on top of local traffic, agriculture, and industrial activity.
Eugene-Springfield, Oregon

Eugene ranks third for year-round particle pollution and second for short-term spikes in the 2026 report. The city sits in the southern Willamette Valley of Oregon, where wood stoves used for winter heat and smoke from increasingly large summer wildfires both feed the air. Valley terrain and calm winter air hold that smoke in place, and the severe wildfire seasons of recent years have pushed Oregon cities up both particle-pollution lists.
Fresno-Hanford-Corcoran, California

Fresno ranks fourth for year-round particle pollution. It is a hub for one of the most intensive agricultural regions in the country, and farm operations, freight idling and moving along State Route 99 and Interstate 5, and the same valley inversions that affect Bakersfield all contribute. Fresno recorded its lowest year-round average in the history of the report in 2026, though its grade is still failing.
Visalia, California
Visalia, also in the San Joaquin Valley between Fresno and Bakersfield, tied for fifth worst for year-round particle pollution. The mix is familiar for the valley: agricultural dust and diesel, residential wood burning in winter, and vehicle traffic, all held in by the surrounding terrain. Visalia recorded its best-ever year-round average in the 2026 report and one of the largest single-year drops in daily particle spikes, cutting more than 17 bad-air days, but it remains among the most polluted metros in the country.
San Diego-Chula Vista-Carlsbad, California

San Diego recorded the single biggest jump on the 2026 year-round list, climbing from 59th worst to a tie for fifth. Cross-border pollution from the Tijuana area, emissions from one of the busiest port complexes on the West Coast, dense freeway traffic, and wildfire smoke all factor into the reading. The size of the jump shows how quickly a metro's standing can change when wildfire years and regional sources line up.
San Jose-San Francisco-Oakland, California

The San Jose, San Francisco, and Oakland metro remains among the worst in the country for year-round particle pollution, though it recorded its lowest reading on record in the 2026 report for the second year in a row. Heavy commuter traffic, shipping and port activity around the bay, and wildfire smoke during late-summer and fall fire seasons are the main contributors.
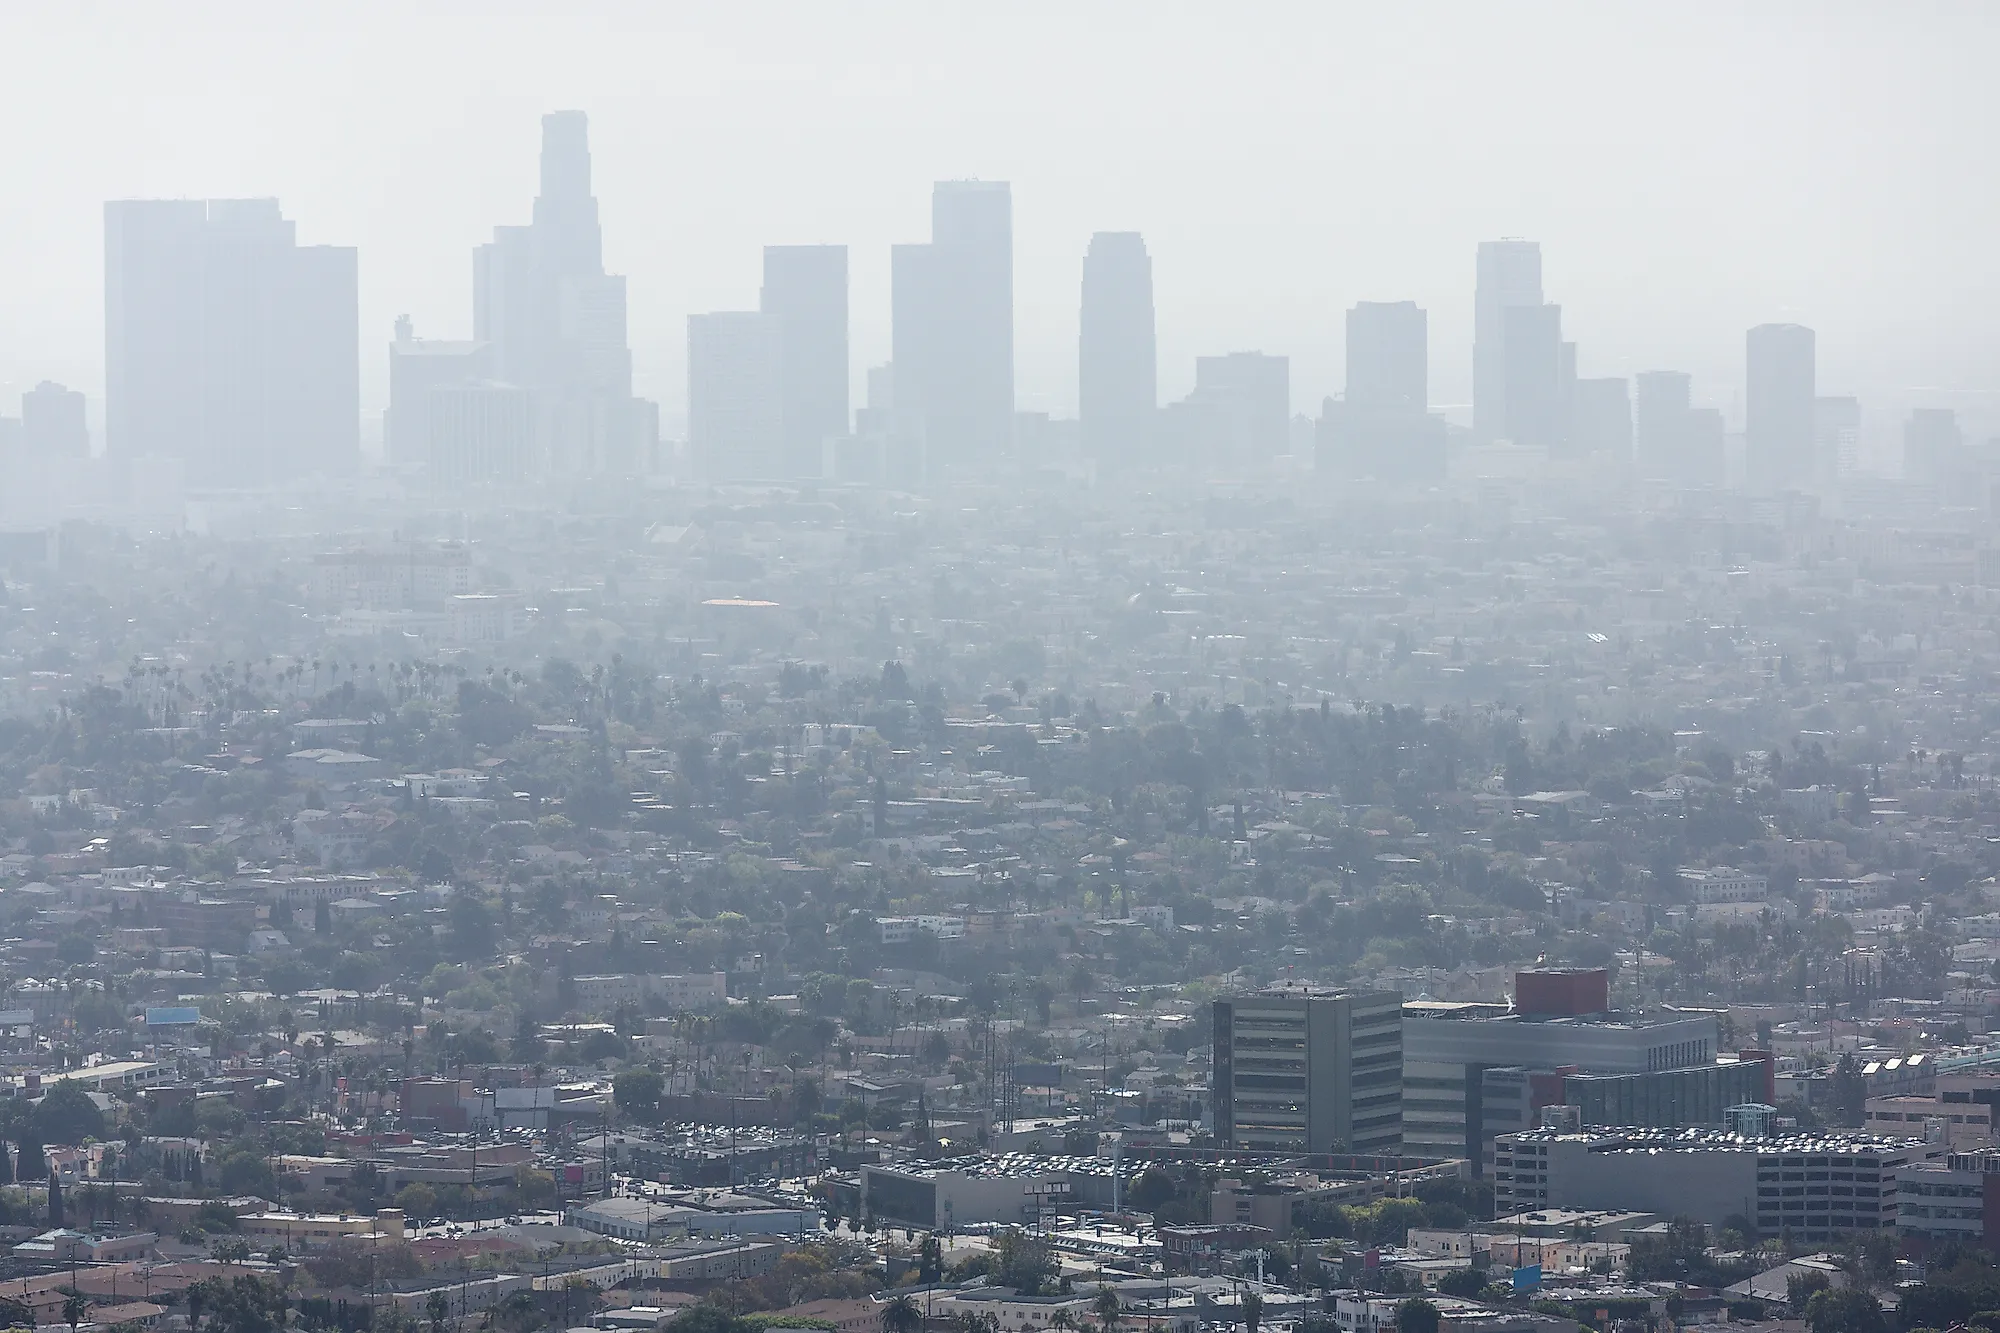
Los Angeles-Long Beach, California

Los Angeles and Long Beach posted improvements in year-round particle pollution, reaching their lowest level on record for the second straight year, and the metro stays on the worst list. The Los Angeles Basin combines the nation's busiest port complex, enormous freeway traffic, and a geography that pins emissions against the mountains. The same metro remains the worst in the country for ozone, the smog that forms when sunlight reacts with traffic and industrial emissions, a distinction it has held in 26 of the report's 27 years.
Detroit-Warren-Ann Arbor, Michigan

The Detroit metro ranks ninth for year-round particle pollution in 2026, an improvement from sixth in the previous report. Heavy industry, auto manufacturing, and dense highway traffic are long-standing sources, and the region was hit hard in 2023 when smoke from wildfires in Canada drifted south and settled over the Midwest. Wayne County, the metro's worst, averaged more than nine unhealthy fine-particle days a year over the period the report covers.
Pittsburgh-Weirton-Steubenville, Pennsylvania

Pittsburgh and the surrounding river valleys reaching into Ohio and West Virginia stay on the worst list for year-round particle pollution, though the metro posted its best-ever reading in 2026. A legacy of steel and coke production, ongoing industrial activity, coal-fired power generation in the region, and river-valley terrain that traps cool air and pollution in winter all keep levels elevated.
The Worst U.S. Metro For Each Type Of Air Pollution
The "State of the Air" report grades three separate pollutants, and the metro that ranks worst depends on which one is measured. The 2026 report's leaders in each category were:
| Pollution measure | Worst U.S. metro area (State of the Air 2026) |
|---|---|
| Year-round particle pollution (annual soot) | Bakersfield-Delano, California |
| Short-term particle pollution (daily spikes) | Fairbanks-College, Alaska |
| Ozone (smog) | Los Angeles-Long Beach, California |
Why The Same Regions Keep Appearing
California holds seven of the 26 metros on the 2026 worst list for year-round particle pollution, and Texas now holds six, the result of fine-particle levels rising across several southern states while much of the rest of the country improved. The pattern behind the rankings is consistent: valleys and basins that trap air, heavy concentrations of traffic and industry, agricultural and oil-and-gas work, winter wood burning, and wildfire smoke that increasingly crosses state and national lines. Nationwide, 76 million people live in counties that fail the year-round particle standard, 62 million in counties that fail for daily spikes, and 129 million where ozone reaches unhealthy levels. The report's authors tie much of the recent volatility, especially the wildfire smoke that reshuffled the 2023 and 2024 data, to a warming climate.