The Counties Sinking Into The Ground
Parts of California's San Joaquin Valley have dropped nearly 30 feet since your great-grandparents' day, and almost nobody standing there would notice. That is the strange thing about land subsidence: it happens by the inch, it hides in ground that still looks dead flat, and once fine sediments compact underground, the land does not spring back. The U.S. Geological Survey has clocked it across more than 17,000 square miles in 45 states, and more than 80 percent of it traces back to one habit, pumping groundwater faster than nature refills it. The counties below are where the sinking runs deepest and the instruments watch hardest, whether the ground in question is a Western farm valley or the tidal edge of the Chesapeake.
Fresno County, California

Western Fresno County sits inside one of the most severe subsidence zones ever measured in the United States, at the heart of the San Joaquin Valley. Heavy groundwater pumping lowered pressure in the valley's aquifer system for decades. By 1970, parts of the valley had dropped as much as 28 feet. The Los Banos-Kettleman City area crosses western Fresno County and includes some of the deepest recorded sinking. Clay and silt layers compressed as water levels fell, permanently reducing aquifer storage in places.
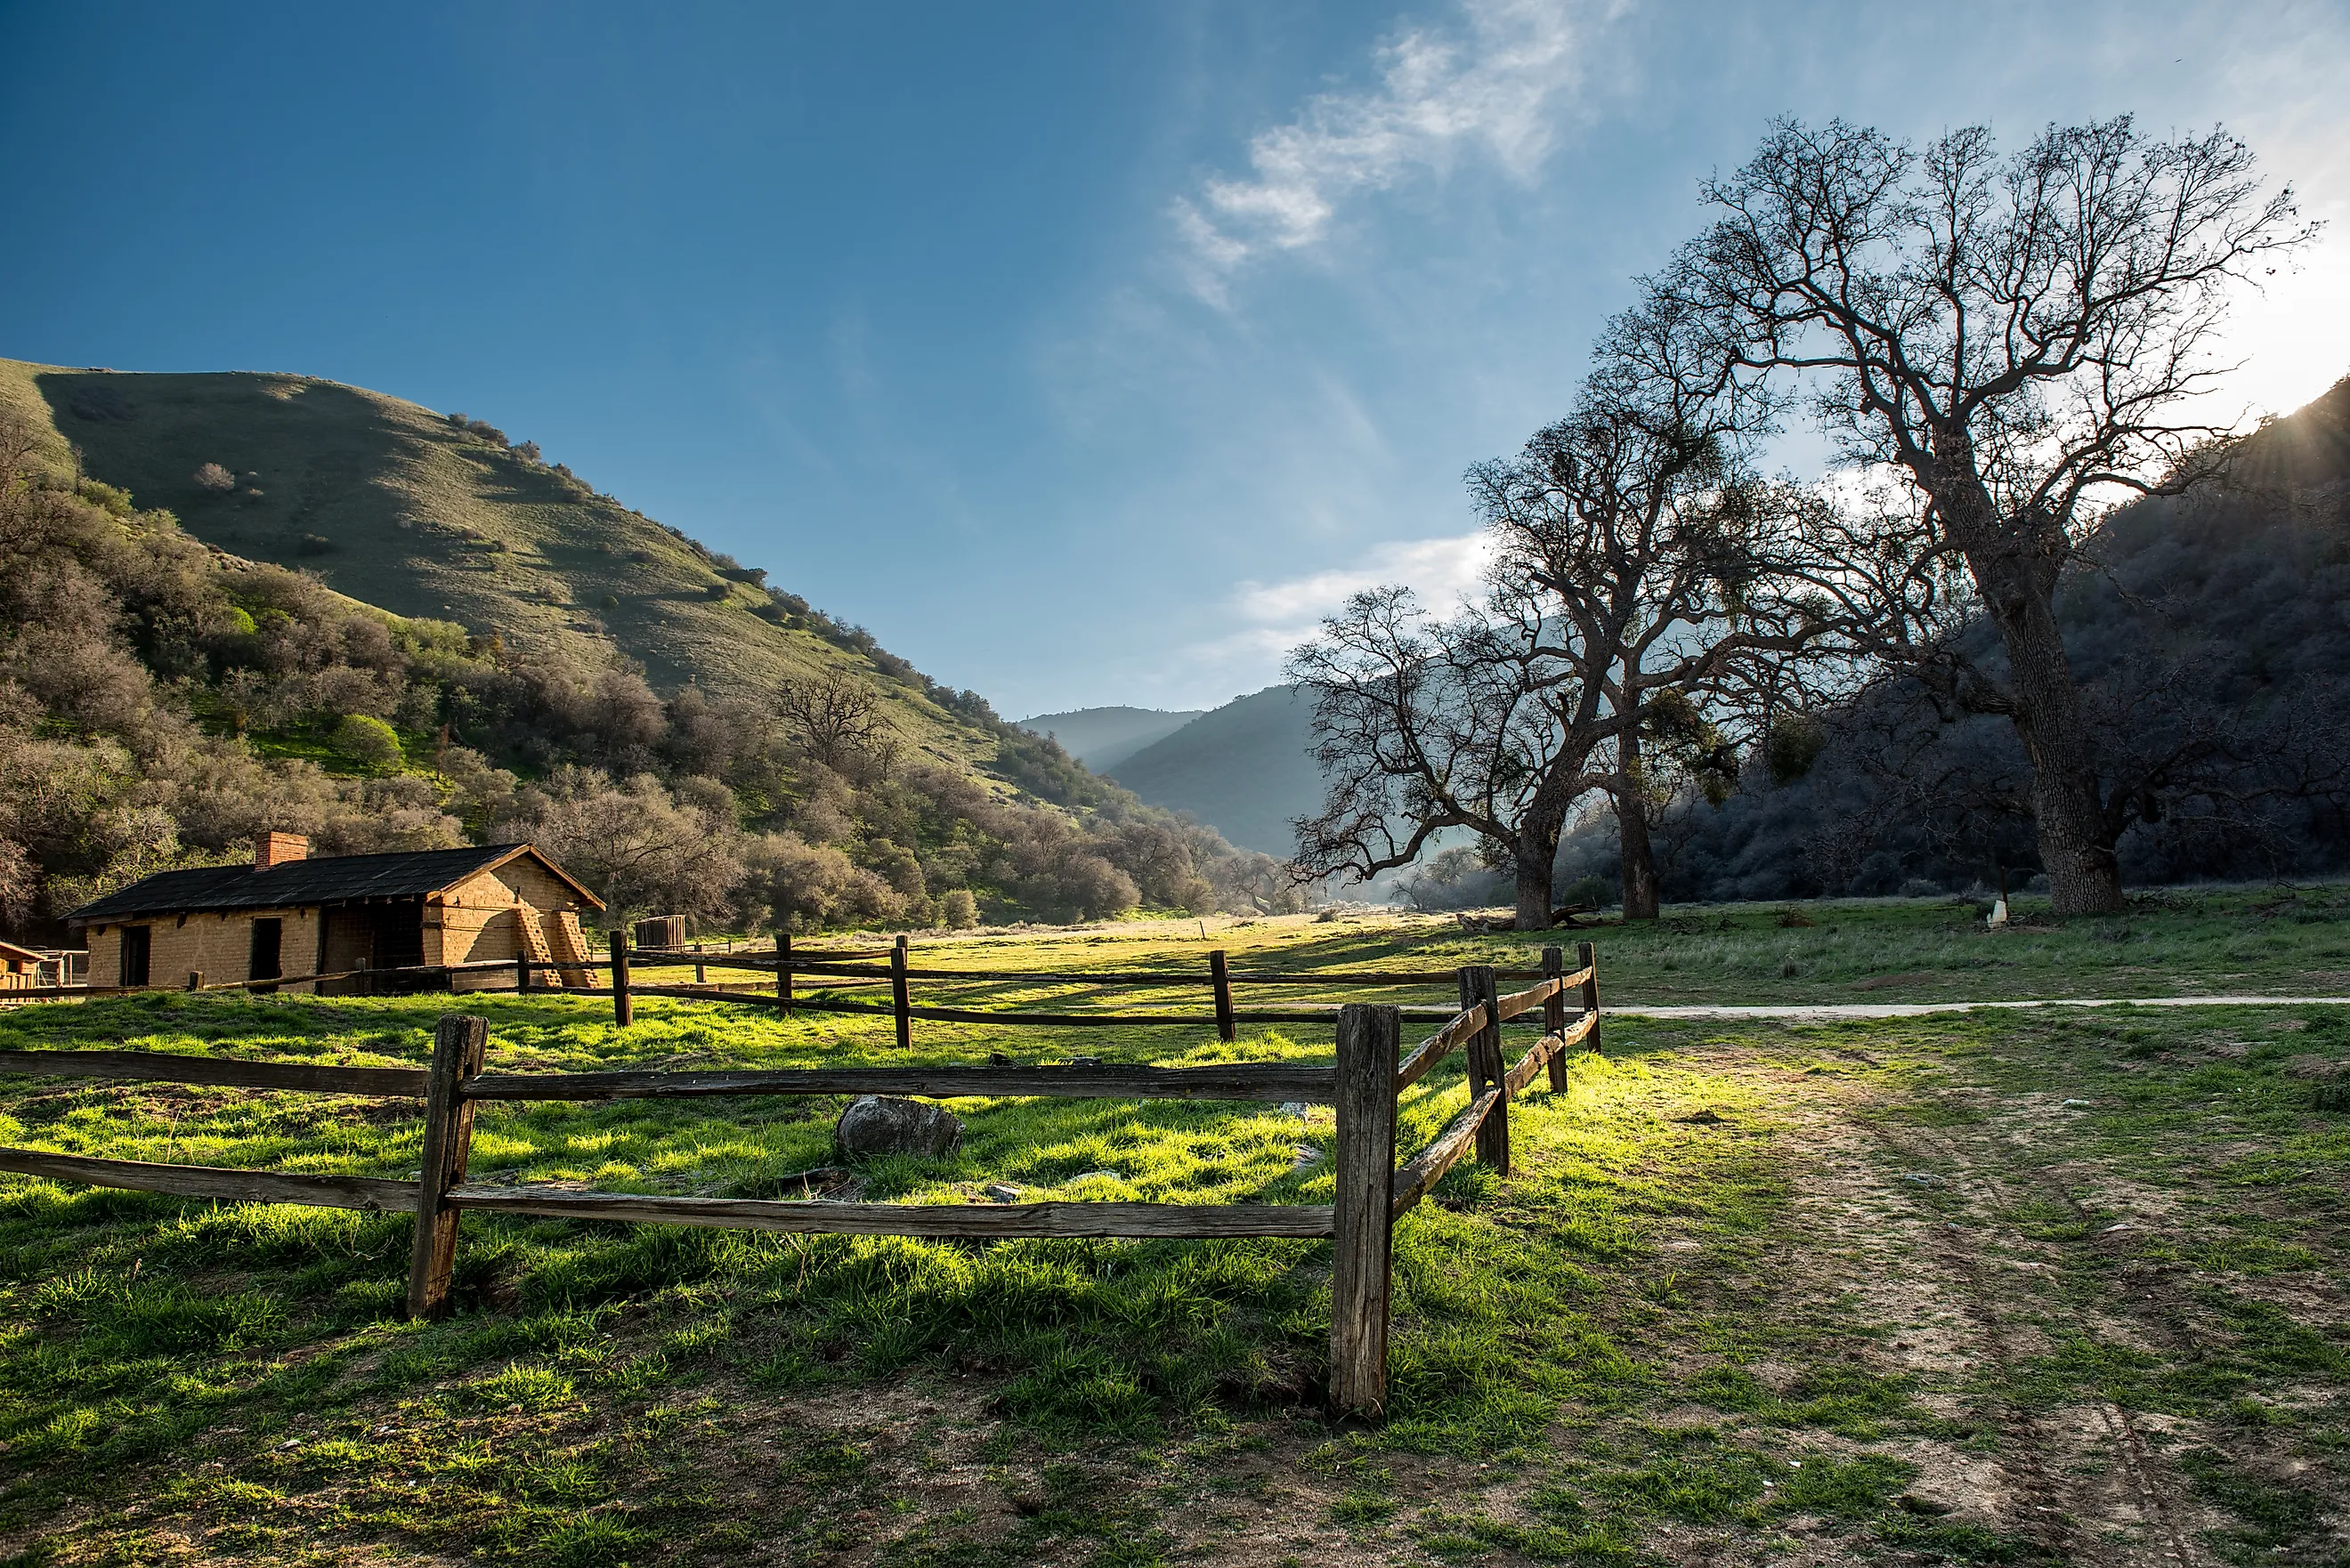
The damage extended to major water infrastructure. Sections of canals lost carrying capacity as the land surface changed elevation around them. USGS surveys have continued to record active subsidence across the San Joaquin Valley, especially during droughts when groundwater use rises. Western Fresno County can look almost perfectly level from the road, yet survey markers record enormous vertical change. Some farm fields now sit many feet below their early twentieth-century elevations. Drainage, canals, wells, and future groundwater storage all depend on those altered elevations.
Pinal County, Arizona

Around Picacho, Eloy, and Stanfield, the desert floor has dropped by extraordinary amounts. Arizona records show about 11.8 feet of subsidence near Stanfield by 1977. Eloy had lost about 12.5 feet. Near Picacho, later measurements added several more feet, bringing the long-term total close to 20 feet in the most affected area.
Groundwater pumping drove much of the change. Agricultural wells removed water faster than the aquifer could recover, allowing fine sediments underground to compact.
The surface responded unevenly. Pinal County has extensive earth fissures where neighboring sections of ground moved by different amounts. Arizona agencies had mapped more than 124 miles of fissures within the Pinal Active Management Area by 2012. Satellite instruments now track the Maricopa-Stanfield and Picacho-Eloy subsidence zones in detail, and recent state maps continue to record movement across both areas.
Maricopa County, Arizona

Several separate subsidence bowls lie beneath metropolitan Phoenix and the surrounding desert. Arizona water officials have documented more than 18 feet of historical sinking in parts of Maricopa and neighboring Pinal counties. Western Maricopa County recorded some of the largest totals between the 1950s and 1990s. Subsidence altered the engineered slope of the Dysart Drain and contributed to flooding at Luke Air Force Base in 1993. Other monitored areas include the East Valley, Rainbow Valley, Gila Bend, Harquahala Valley, and the Scottsdale-Northeast Phoenix zone. Chandler, Gilbert, Mesa, Scottsdale, Goodyear, Phoenix, and nearby communities overlap parts of these mapped features. State agencies continue to use satellite radar to measure motion across the county, and recent monitoring shows faster movement in some pockets and much slower movement in others.
Tulare County, California

Tulare County was sinking fast enough to attract federal attention before the middle of the twentieth century. Surveys in the Tulare-Wasco area recorded about five feet of subsidence by 1940. By the 1950s, the total exceeded ten feet in the most affected locations. Rates near 0.8 foot per year were measured during part of that period. Falling artesian pressure was a major cause.
Recent droughts have kept subsidence active across the southern Central Valley. State water officials reported accelerated sinking during the 2020-2022 drought as groundwater extraction increased. The Tulare Lake hydrologic region still contains active subsidence zones.
Irrigation canals, wells, drainage systems, roads, and flood-control works depend on carefully managed elevations. A few inches of uneven movement can change how water flows through a flat agricultural basin. Tulare County has recorded changes measured in feet. The broad fields and straight roads can hide the scale until survey data are compared across decades.
Harris County, Texas

Greater Houston holds one of the longest urban subsidence records in the country. In Pasadena, southeast of central Houston, the ground dropped as much as 7.5 feet between 1943 and 1973. More than another foot had accumulated during the earlier 1906-1943 period. Heavy withdrawal from the Chicot and Evangeline aquifers caused much of that movement.
Water management reduced sinking in some older problem areas, and then the center of activity shifted. Satellite measurements published in 2025 put the median Houston subsidence rate near 5.3 millimeters per year for 2016-2023. Parts of northwest Harris County exceeded 20 millimeters per year. Bayous, highways, pipelines, industrial sites, and dense neighborhoods cross zones moving at different speeds. A separate national study ranked Houston as the fastest-subsiding city on average among 28 major U.S. cities examined, with large portions of the city dropping faster than five millimeters per year during the study period.
Kern County, California

The California Aqueduct crosses a major subsidence zone in Kern County. State water officials report about five feet of sinking along portions of the aqueduct since its completion in 1967. The elevation loss has reduced water-delivery capacity and increased maintenance demands on the State Water Project.
California is installing dedicated monitoring stations along the aqueduct in Kern County. The equipment includes extensometers, groundwater wells, continuous GPS units, and boreholes reaching thousands of feet underground. These instruments measure which layers are compacting and how quickly the surface responds.
Some areas near the aqueduct had already lost 20 to 30 feet before construction began. Another period of rapid sinking occurred during the 2013-2016 drought. A canal built to a precise slope loses efficiency when one section drops faster than another. Along this stretch of the State Water Project, the change shows up directly in reduced canal capacity.
Kings County, California

Kings County occupies the Tulare Lake Basin, where groundwater pumping and intensive agriculture have produced persistent subsidence. The county's hazard planning documents identify ongoing land subsidence across a significant portion of its territory. Local officials treat groundwater dependence as one of the main reasons the risk is so widespread.
The most serious episodes often coincide with dry years. During the 2020-2022 California drought, increased groundwater extraction accelerated sinking across parts of the Central Valley. State monitoring continues to identify active subsidence within the Tulare Lake hydrologic region, which includes Kings County. The changes can reach canal gradients, drainage, wells, roads, and available aquifer storage. Much of Kings County looks broad and flat, so gradual elevation loss is difficult to spot from a passing car. Surveying and satellite radar reveal movement spread across large agricultural areas.
Orleans Parish, Louisiana

New Orleans sits on young Mississippi Delta sediments that continue to compact under parts of Orleans Parish. Federal surveys covering 1951-1995 estimated average subsidence near five millimeters per year across leveed sections of metropolitan New Orleans. The causes vary by location and include shallow sediment compaction, drainage, groundwater changes, structural loading, fault movement, and deeper geological processes.
Recent satellite work has sharpened the local picture. A 2025 study measured very small changes across many parts of New Orleans during its observation period. Localized zones moved much faster, reaching about 20 millimeters per year in some places. Sections of flood-protection infrastructure recorded even higher localized rates.
Orleans Parish already sits close to sea level. Subsidence adds directly to relative sea-level rise and shifts elevation relationships among neighborhoods, levees, canals, and surrounding water. Nearby blocks can have very different movement histories. Engineers rely on precise monitoring because differences this small accumulate over years and are hard to see at street level.
Clark County, Nevada

Las Vegas Valley has a long record of groundwater-related subsidence. Deep aquifer levels fell by as much as 280 feet after pumping expanded during the twentieth century. USGS studies measured land subsidence reaching about five feet in parts of the valley. Changes in water supply and groundwater management slowed the most extreme historical movement. Recent satellite measurements still detect localized sinking. Research covering 2015-2021 found spots around Las Vegas exceeding five millimeters per year, including areas near Northgate and Los Prados. The basin contains layers of clay, silt, sand, and gravel that respond differently as groundwater pressure changes. Roads, pipelines, buildings, and drainage systems cross boundaries between faster and slower moving ground. Decades of aquifer use have left measurable changes beneath one of the country's fastest-growing desert metropolitan areas.
King William County, Virginia

West Point, at the eastern end of King William County, is a documented subsidence hotspot on Virginia's Coastal Plain. Recent USGS work places local sinking near 3.2 millimeters per year. Groundwater withdrawal and compaction within the aquifer system are major contributors.
USGS crews completed a 1,371-foot extensometer at West Point in December 2024. The instrument measures tiny changes within underground sediment layers and helps separate shallow movement from deeper aquifer compaction.
West Point sits beside tidal waters connected to the Chesapeake Bay, so each millimeter of land loss adds to relative sea-level rise. The new station gives scientists a precise record tying groundwater use to coastal geology in eastern Virginia. Its instruments now track changes beneath a small river town where surface movement would otherwise be almost impossible to notice.
What The Measurements Add Up To
These ten counties sink for reasons that rhyme more than they repeat. In the San Joaquin Valley and the deserts of Arizona and Nevada, farm and municipal wells pulled water out of fine-grained sediments faster than the aquifers could recover, and the compacted layers will not spring back. Along the Gulf and the Chesapeake, that same pumping compounds a coastline already losing elevation to young sediments and rising seas, which turns a few millimeters a year into a flooding problem. The common thread is that the change is nearly invisible at eye level and permanent once it happens, which is why extensometers, GPS stations, and satellite radar now watch ground that looks, from any road, perfectly still.