Which Ocean is the Cleanest?
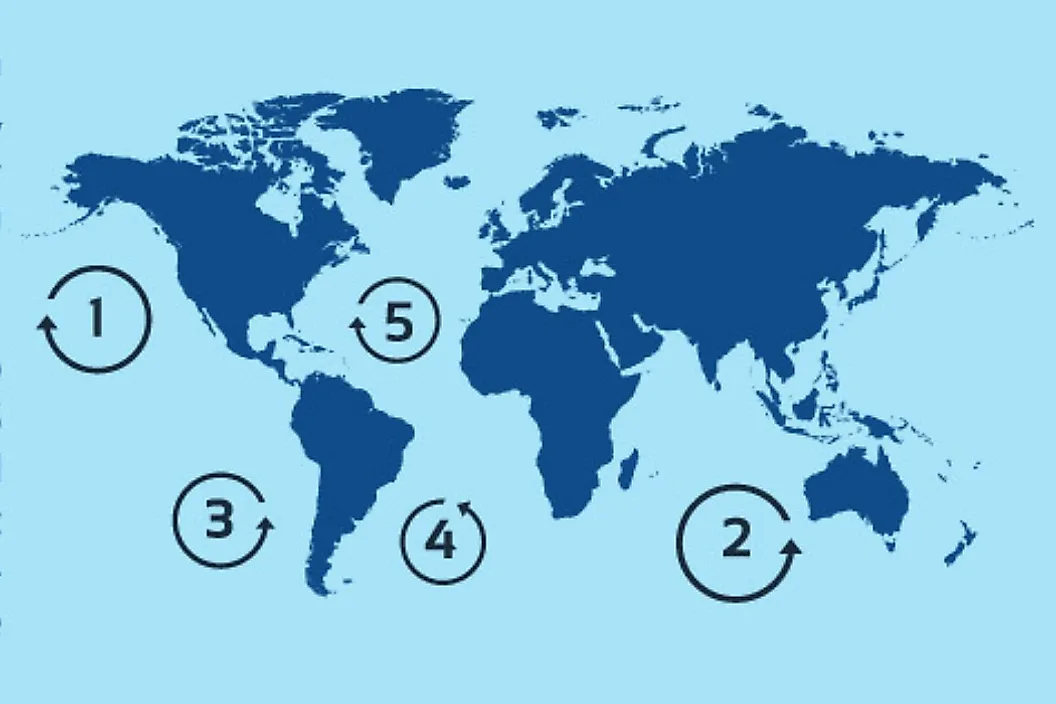
The South Atlantic is the cleanest of the world's five major oceans by the most commonly cited measure: floating plastic particles. The foundational 2014 study by oceanographer Marcus Eriksen and the 5 Gyres Institute estimated 297 billion plastic pieces in the South Atlantic against roughly 2 trillion in the North Pacific. The methodology has been refined since, and modern estimates of total ocean plastic now range from 75 to 199 million metric tons, with another 11 to 14 million metric tons added annually per the International Union for Conservation of Nature (IUCN) and the US State Department. The relative ordering of the oceans has not changed: the cleanest oceans are in the Southern Hemisphere because the Southern Hemisphere is less populated and less industrialized, and the dirtiest are in the Northern Hemisphere for the same reason inverted.
South Atlantic Ocean: The Cleanest

The South Atlantic holds the lowest count of floating plastic pieces of any major ocean, approximately 297 billion in the Eriksen 2014 inventory. The South Atlantic Gyre, the rotating current system in the South Atlantic, does concentrate debris into what is sometimes informally called the South Atlantic garbage patch, but the underlying input volume is far lower than in the Northern Hemisphere gyres. The reason is straightforward demographics: only about 6 percent of the world's population lives along South Atlantic coasts (primarily in southern Brazil, Argentina, Uruguay, and southwestern Africa), and the shipping density between South America and southern Africa is low compared to the trans-Pacific and trans-Atlantic Northern Hemisphere routes. The ocean's relative cleanliness should be read in context: even 297 billion pieces is an enormous absolute count, and microplastic concentrations in the South Atlantic have been measured in the hundreds of particles per cubic meter near coastlines.
South Pacific Ocean

The South Pacific holds approximately 491 billion plastic pieces, the second-lowest count after the South Atlantic. The South Pacific Subtropical Gyre concentrates debris in the central basin, where what is sometimes called the South Pacific garbage patch was confirmed by an Algalita Marine Research Foundation expedition in 2011. The South Pacific basin includes the largest single area of low population on Earth (the Polynesian and southern Pacific waters between South America and Australasia are mostly empty of major shipping lanes), which keeps the input volume low. The exceptions are around Chile and Peru on the east, and around the Pacific island nations of Polynesia, Melanesia, and parts of Micronesia, where shoreline plastic accumulation can be severe even though the open-ocean count is low.
Indian Ocean

The Indian Ocean holds approximately 1.3 trillion plastic pieces, more than four times the South Atlantic figure. The Indian Ocean was long believed to have no large garbage patch; the Indian Ocean Patch was confirmed by Sea Education Association researchers in 2010, located in the South Indian Ocean Subtropical Gyre. Major plastic input comes from the densely populated river basins draining into the ocean, most notably the Ganges in India and Bangladesh and the Indus in Pakistan. (Schmidt et al.'s widely cited 2017 study claimed 10 rivers contributed 90 percent of ocean plastic; a more careful 2021 reanalysis by Meijer et al. revised this to over 1,000 rivers contributing 80 percent, with the Ganges still in the top 10 by individual river.) The Indian Ocean also receives heavy plastic input from Southeast Asia (Indonesia, Thailand, Vietnam, Philippines), all of which the 2015 Jambeck et al. study identified as among the top five countries by mismanaged plastic waste.
North Atlantic Ocean

The North Atlantic Ocean holds approximately 930 billion plastic pieces. The North Atlantic Subtropical Gyre concentrates floating debris into the North Atlantic garbage patch, a less well-known counterpart to the Great Pacific Garbage Patch. The patch was identified in 1972 (one of the earliest documented oceanic garbage accumulations) and confirmed by the Sea Education Association's 22-year (1986-2008) dataset of 64,000 net tows, which found the highest plastic concentrations at roughly 22 to 38 degrees north. The North Atlantic basin is bordered by the eastern United States, Western Europe, the Caribbean, northeastern South America, and West Africa, all heavily industrialized regions with major shipping lanes (the trans-Atlantic and US-Caribbean routes carry an enormous share of global cargo) and heavily populated coastlines.
North Pacific Ocean: The Most Polluted
The North Pacific is the most polluted of the five oceans, holding approximately 2 trillion plastic pieces (roughly a third of the global ocean total). It is also the location of the Great Pacific Garbage Patch, the largest of the five major ocean garbage patches, which sits in the North Pacific Subtropical Gyre between California and Hawaii. The patch covers an area of about 1.6 million square kilometers (twice the size of Texas, or three times the size of France) and contains an estimated 1.8 trillion pieces of plastic weighing around 80,000 metric tons, per the Ocean Cleanup project's 2018 sampling expedition. About 46 percent of that mass is discarded fishing gear (often called "ghost gear"), with the remainder a mix of microplastics, consumer packaging, and other debris. The North Pacific basin is bordered by China, Japan, Korea, the Philippines, the Russian Far East, and the western United States, with the densest shipping traffic of any ocean and several of the world's largest rivers draining into it (the Yangtze in particular is one of the largest contributors of riverine plastic to any ocean).

Causes And Cleanup Efforts
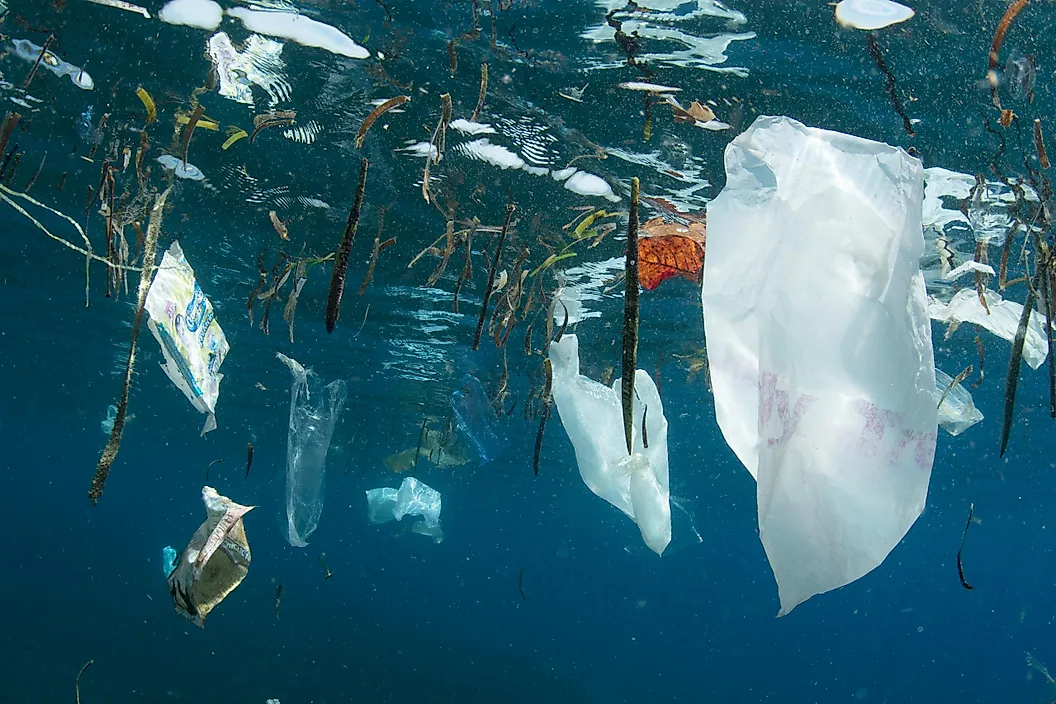
Approximately 80 percent of ocean plastic originates on land and reaches the sea through river systems and stormwater runoff; the remaining 20 percent comes from marine sources, primarily abandoned fishing gear and waste discarded by ocean-going vessels. The five countries contributing the most mismanaged plastic to the ocean, per the Jambeck 2015 and Meijer 2021 studies, are China, Indonesia, the Philippines, Vietnam, and Thailand. Oil tankers, offshore drilling rigs, and sunken cargo ships contribute additional non-plastic pollutants (chemicals, crude oil, heavy metals).
Active cleanup efforts include the Ocean Cleanup, the Dutch nonprofit founded by Boyan Slat in 2013, which operates passive collection systems in the Great Pacific Garbage Patch and Interceptor systems in 10 of the most polluting rivers. The organization announced in 2024 that it had removed 10 million kilograms of plastic from oceans and rivers combined since beginning operations. The UN Environment Programme's Global Plastics Treaty negotiations, launched in 2022 with a target to end plastic pollution by 2040, are ongoing.
A Note On The Numbers
The figures above derive almost entirely from the Eriksen et al. 2014 study and its subsequent updates. That study modeled global ocean surface plastic counts using 680 plankton net tows and a wind-mixing correction, and produced the running estimate of 5.25 trillion total floating plastic pieces weighing about 269,000 tons. The figures are best read as upper-bound estimates of the visible surface fraction: subsequent work (Cózar et al. 2014, van Sebille et al. 2015, CSIRO 2023) has indicated that the surface count represents only about 1 percent of the total plastic in the ocean, with the rest sitting in the water column, the deep sea, the sea floor, and arctic sea ice. The relative ranking of the oceans (South Atlantic cleanest, North Pacific dirtiest) appears robust across studies, but the absolute totals should not be read as precise counts. The Mediterranean Sea, though not a major ocean, holds an estimated 247 billion plastic pieces in a much smaller basin and has the highest plastic density per square kilometer of any sea on Earth.