States With The Lowest Home Ownership Rates
In most of America, owning your home is the default: nationwide, about 65% of households do. But in a few states the math tilts hard toward renting, and in New York nearly half of all households rent rather than own. The reasons are not mysterious. Pricey housing, dense cities stacked with apartments, and large populations of people who move through rather than put down roots all drag ownership rates down. Here is where buying a home is rarest, and why, using the Census Bureau's latest data, from 2024.
New York, California, And Nevada Anchor The Bottom

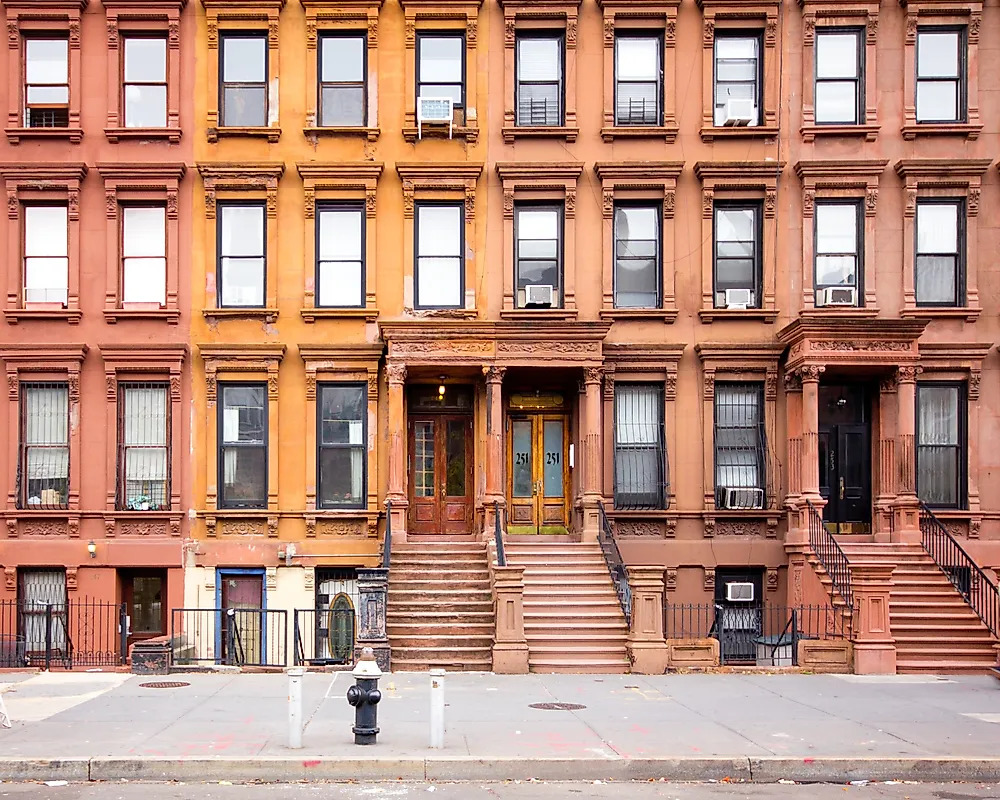
Three states sit well clear of the pack. New York is the lowest in the country at 54.3%, which is another way of saying nearly half of New York households rent. Blame New York City: where a studio can cost more than a house does elsewhere, and apartment towers vastly outnumber single-family lots, renting is simply the path of least resistance. California is right behind at 55.9%, weighed down by the same forces in Los Angeles and the Bay Area, where the typical home runs well over $700,000. Nevada rounds out the bottom three at 60%, a figure that has actually crept up as Las Vegas matures but still reflects a transient, service-heavy economy in which a lot of workers rent. Washington, DC, is lower than any of them at about 41%, but it is a federal district, not a state.
The College-Town Effect

Massachusetts has the fourth-lowest ownership rate in the country at 62.5%, and a big part of the explanation wears a backpack. The seventh-smallest state by land area, Massachusetts is packed with roughly a hundred colleges and universities, and every student renting a place near campus is one more household on the renter side of the ledger. Greater Boston alone churns through tens of thousands of student renters a year. Rhode Island, its tiny neighbor, lands close behind at 63.6% for much the same reasons, with Providence's college crowd and steep coastal-state prices doing the work.
It Is Not Just The Coasts

The easy story is that low ownership is a big-city, coastal thing, but the data keeps poking holes in it. Texas has the fifth-lowest rate in the country at 62.6%, even though its homes cost a fraction of California's; the state simply builds and fills apartments faster than buyers can close, especially in fast-growing Austin, Dallas, and Houston. Stranger still is North Dakota, of all places, at 62.9%. The Bakken oil boom pulled in waves of workers who needed somewhere to live immediately, not a thirty-year mortgage, and the rental housing thrown up to house them still shapes the numbers. Low ownership, it turns out, can come out of a roaring economy as easily as an unaffordable one.
Why The Rates Keep Drifting Down
Step back and a national pattern appears: the homeownership rate peaked around 69% in 2004 and has hovered in the mid-60s ever since, never fully recovering. The squeeze is generational. Most baby boomers owned a home by their mid-thirties; only about four in ten millennials do. Home prices have outrun wages, starter homes are scarce, and mortgage rates near 7% have frozen many would-be buyers in place. The states at the bottom of this list are where those pressures bite hardest, the places where buying first became a stretch and then, for many, a non-starter. Whether that is a crisis or simply a shift in how people choose to live depends on who you ask; plenty of renters rent by preference, not defeat.
The Lowest Homeownership Rates By State
These are the fifteen states where owner-occupied housing is rarest, based on the Census Bureau's 2024 American Community Survey. The national rate is about 65%, and Washington, DC, sits lower than any state at roughly 41%, but it is a federal district rather than a state.
| Rank | State | Owner-occupied housing (%) |
|---|---|---|
| 1 | New York | 54.3% |
| 2 | California | 55.9% |
| 3 | Nevada | 60.0% |
| 4 | Massachusetts | 62.5% |
| 5 | Texas | 62.6% |
| 6 | North Dakota | 62.9% |
| 7 | Hawaii | 63.0% |
| 8 | Oregon | 63.3% |
| 9 | Rhode Island | 63.6% |
| 10 | New Jersey | 63.8% |
| 11 | Washington | 63.8% |
| 12 | Georgia | 65.7% |
| 13 | Oklahoma | 65.8% |
| 14 | Colorado | 66.2% |
| 15 | Arkansas | 66.4% |