The US Dams That Power Entire States
In 2025, Grand Coulee Dam generated more electricity than the entire state of South Dakota used all year. The Columbia River project in Washington produced about 16.15 million megawatt-hours, roughly 2.34 million more than utilities sold to every South Dakota customer combined. And 2025 was not even a strong water year. To make this comparison, a plant has to beat a state's full-year electricity sales with the power it actually generated, not the capacity it is rated for. Grand Coulee cleared that bar by about 17 percent. Five more American hydro plants cleared it too, from Chief Joseph in Washington to the Robert Moses plant at Niagara, which is barely a conventional dam at all.
Grand Coulee Dam, Washington

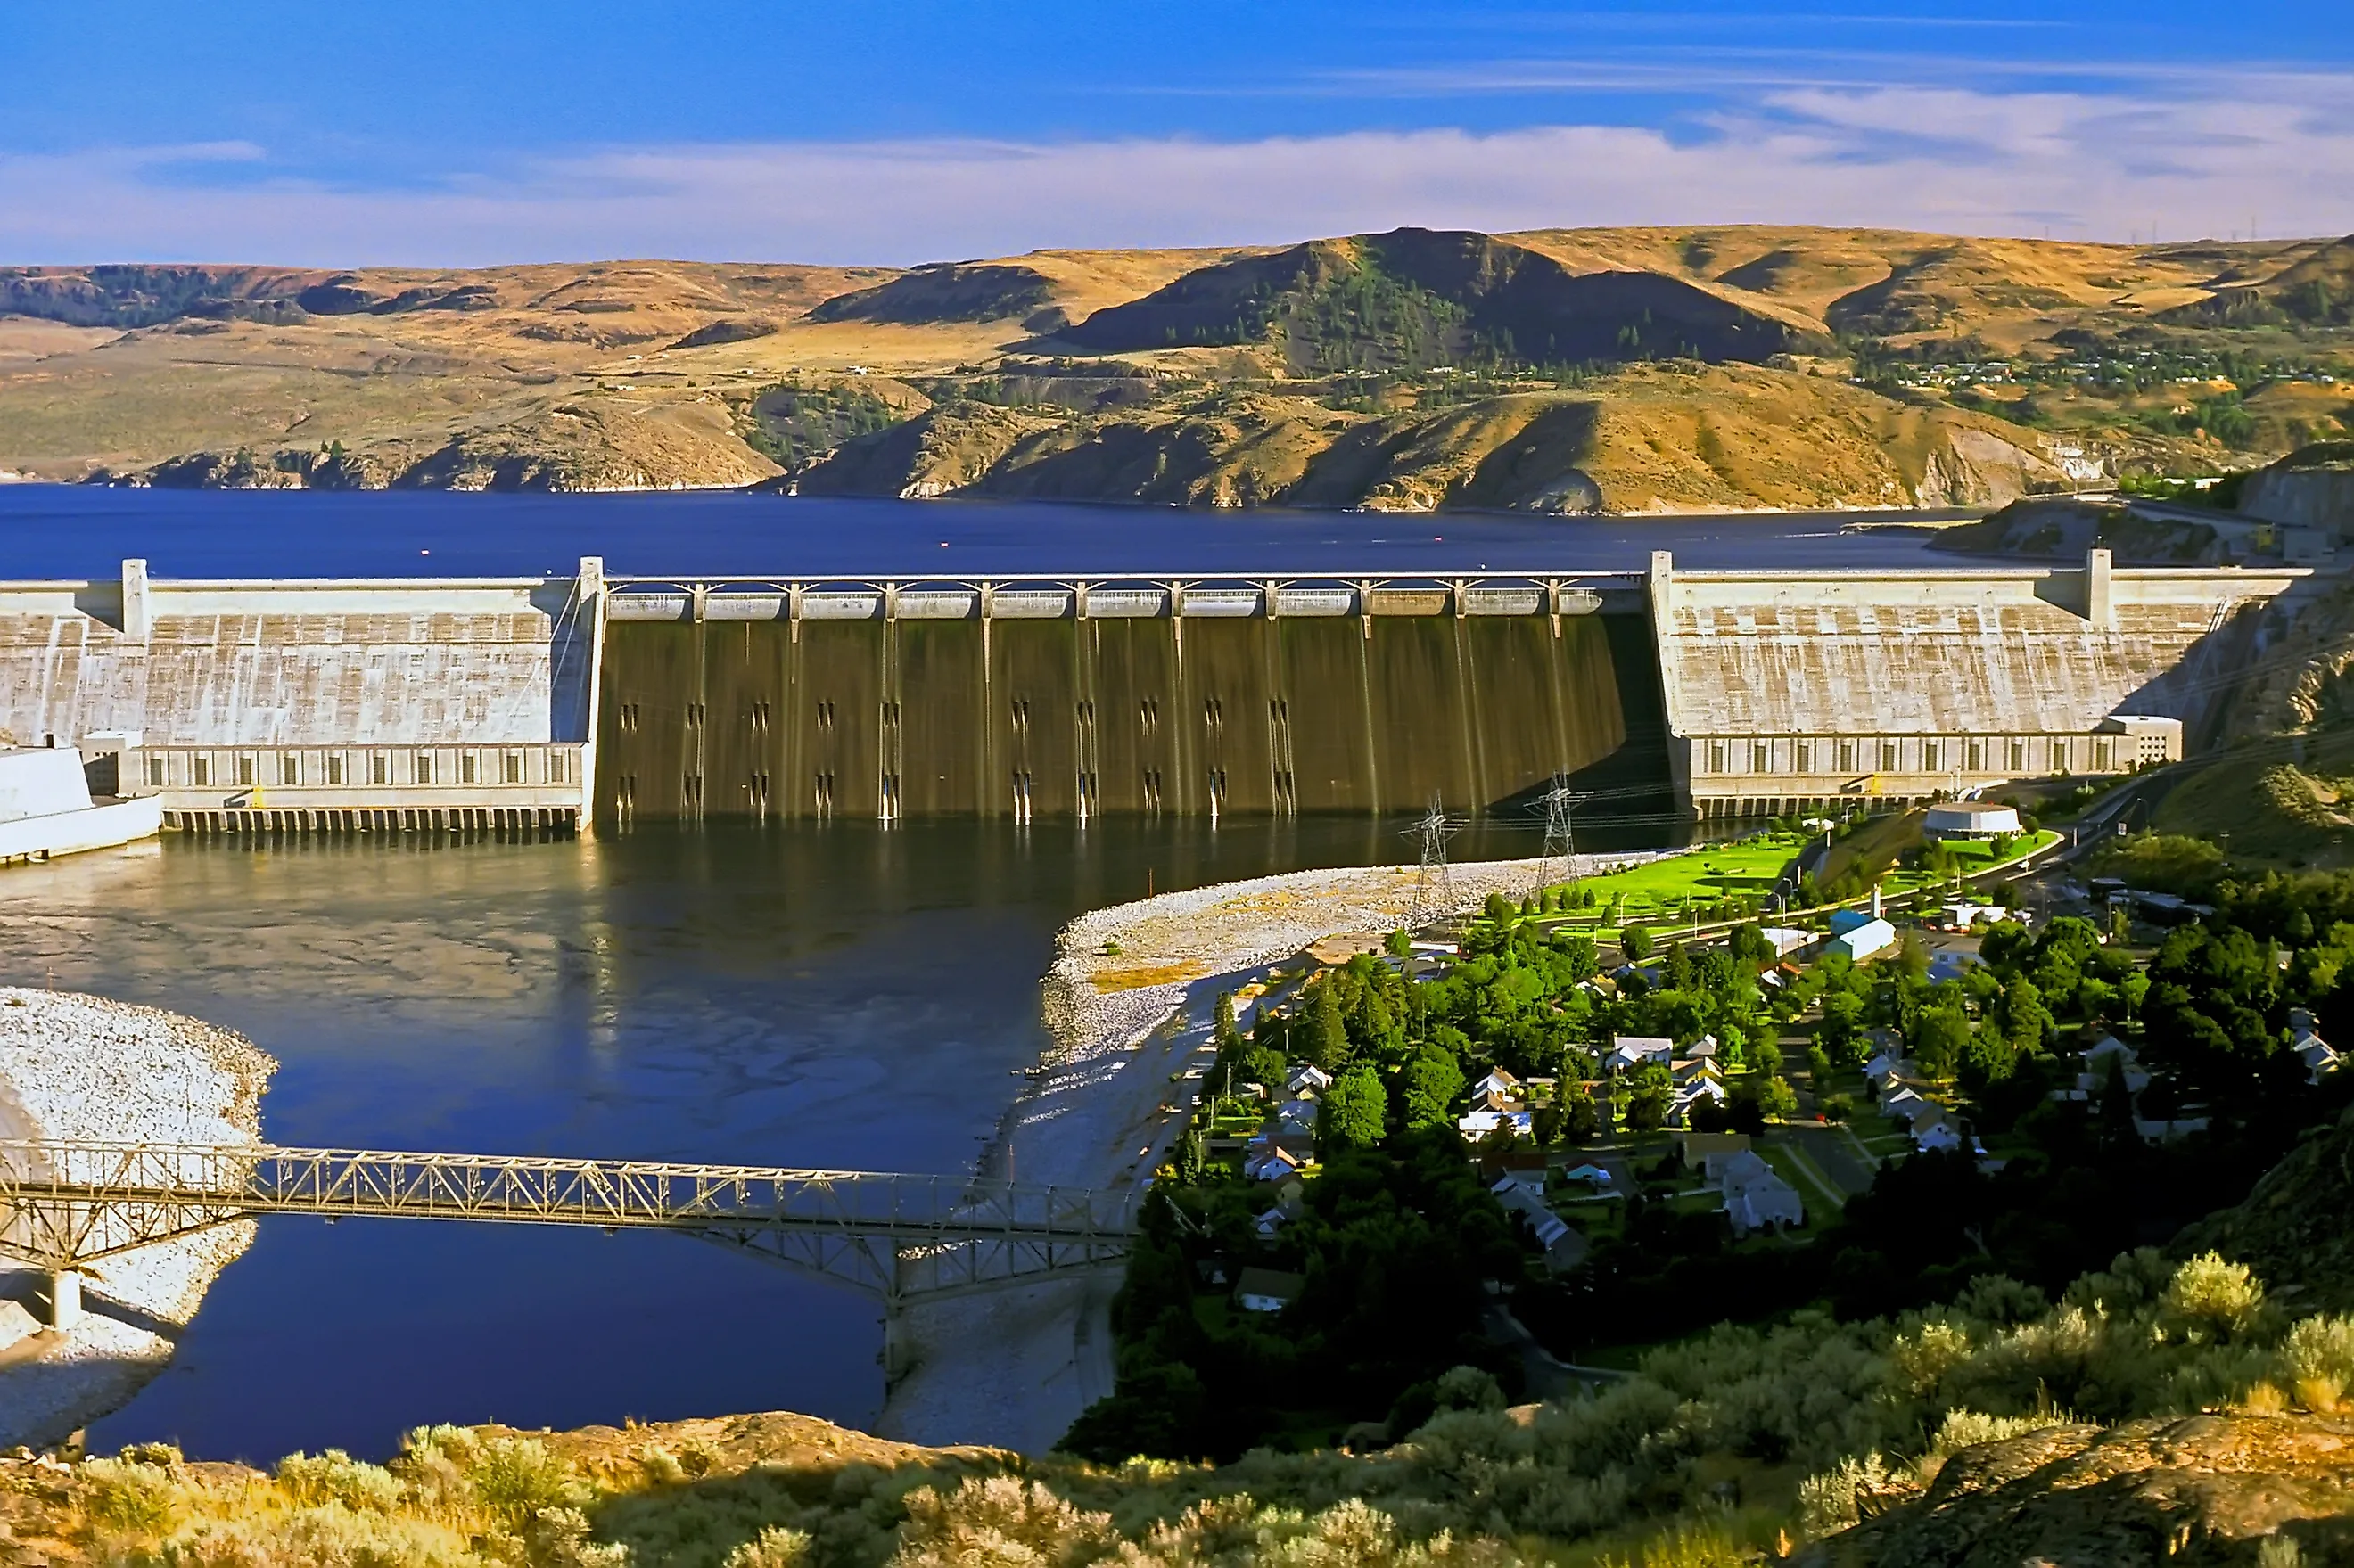
Grand Coulee cleared the state-sized line comfortably in 2025. Final plant records put its net generation at 16,151,147 megawatt-hours, while South Dakota's preliminary retail electricity sales totaled 13.813 million megawatt-hours. The Columbia River complex therefore produced about 2.34 million megawatt-hours more than utilities sold to customers across South Dakota that year.
The Bureau of Reclamation lists Grand Coulee at 5,223 feet long and 550 feet high, with 6,809 megawatts of installed generating capacity. Its long-term average production is around 21 billion kilowatt-hours a year, so the 2025 total was still well below what the project has produced in stronger water years.
Water remained the limiting factor. Northwest River Forecast Center figures cited in Portland General Electric's 2025 annual report put April-through-September runoff at Grand Coulee at 78 percent of normal. That was better than 74 percent in 2024, but hardly a banner water season. Grand Coulee still finished about 17 percent above South Dakota's annual retail electricity sales.
Chief Joseph Dam, Washington

Chief Joseph Dam had a stronger 2025 and reached a bigger state benchmark. Its 27 units produced 9,806,156 megawatt-hours, according to final EIA-based plant records. That is more than Hawaii's preliminary 2025 retail electricity sales of 9.137 million megawatt-hours, a gap of about 669,000 megawatt-hours. The U.S. Army Corps of Engineers calls Chief Joseph the second-largest hydropower-producing dam in the country and the largest hydropower dam it operates. The structure crosses 5,962 feet of the Columbia River near Bridgeport, Washington, while Rufus Woods Lake runs 51 miles upstream. Unlike a giant seasonal storage project, Chief Joseph operates as a run-of-river dam, passing Columbia River flows through a powerhouse more than one-third of a mile long. Its 2025 production came in about 7 percent above the electricity Hawaii utilities sold to customers across the islands.
St. Lawrence-FDR Power Project, New York

For the international power dam at Massena, only the American half of the powerhouse counts in this comparison. Final 2025 plant data show 6,726,939 megawatt-hours from the Robert Moses Power Dam, the U.S. generating station within the St. Lawrence-FDR Power Project. Alaska's preliminary retail electricity sales came to 6.118 million megawatt-hours. That leaves the New York plant roughly 609,000 megawatt-hours ahead.
The machinery is split at the border. NYPA operates 16 turbine-generators on the American side of the Robert Moses-Robert H. Saunders Power Dam, while Ontario Power Generation operates another 16 on the Canadian side. First power arrived in 1958, after construction reshaped this stretch of the St. Lawrence River for navigation and hydropower. Only NYPA's output is counted here; adding the Canadian station would turn it into a different comparison entirely. The American plant by itself finished about 10 percent above Alaska's 2025 retail electricity sales.
John Day Dam, Oregon-Washington
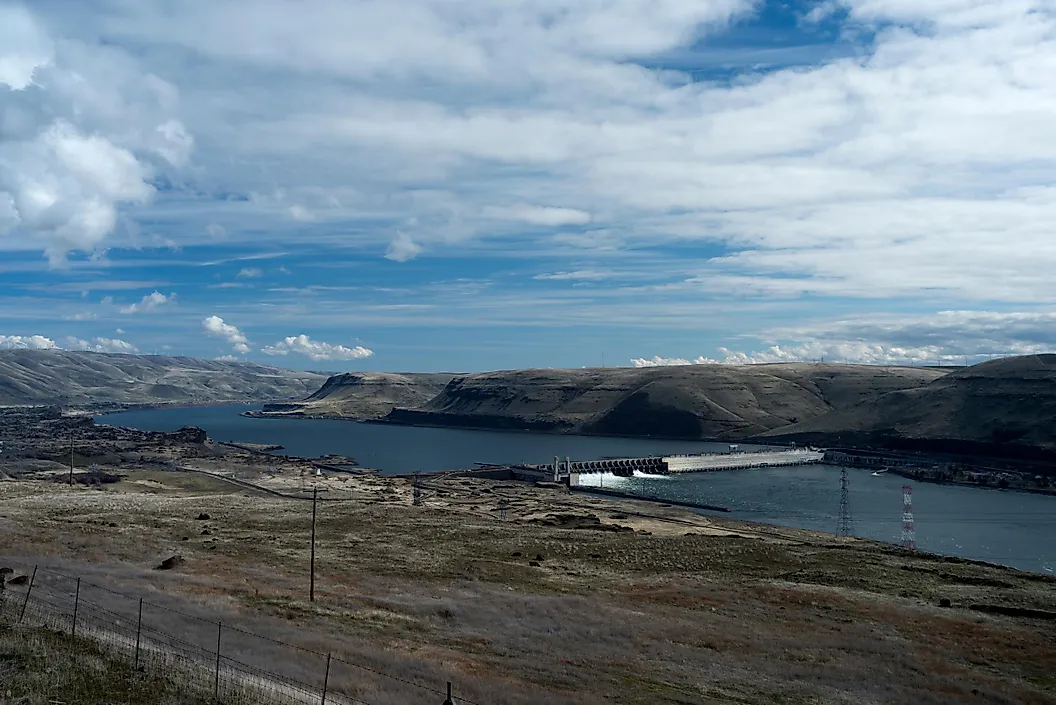
John Day Dam now clears a tougher state benchmark than it did in the 2024 version of this comparison. Final plant records put 2025 generation at 7,589,037 megawatt-hours. Rhode Island's preliminary retail sales were 7.404 million megawatt-hours, leaving just 185,000 megawatt-hours between them. That is a margin of only about 2.5 percent.
The numbers come from a powerhouse built on an unusually large scale. The U.S. Army Corps of Engineers lists 16 generators with 2,160 megawatts of total output capacity. Beside them, the navigation lock can raise or lower vessels by as much as 113 feet.
John Day's changing annual totals also show why installed megawatts cannot settle this question. It made about 6.96 million megawatt-hours in 2024, then climbed past 7.58 million in 2025. That extra water-powered output is what pushed the dam above Rhode Island's full year of retail electricity sales.
The Dalles Dam, Oregon-Washington
The Dalles is the new arrival in the 2025 version. EIA-derived records place the main federal plant at roughly 6.5 million megawatt-hours for the year, comfortably above Vermont's preliminary retail electricity sales of 5.473 million megawatt-hours. That reverses the 2024 result, when The Dalles generated about 5.43 million megawatt-hours and fell just short of Vermont. The U.S. Army Corps of Engineers operates the dam two miles east of The Dalles, Oregon, on the Columbia River, where the project combines hydropower, navigation, and fish passage behind a 24-mile reservoir called Lake Celilo. The rise did not require an exceptional snowmelt year. Northwest River Forecast Center figures cited in Portland General Electric's annual report put April-through-September 2025 runoff at The Dalles at 77 percent of normal, up only modestly from 74 percent in 2024. Yet the added generation was enough to move this Columbia River dam decisively onto the list.
Robert Moses Niagara Power Plant, New York

Niagara no longer takes the top production spot in this group, but it still clears a whole-state comparison. The Robert Moses Niagara Power Plant generated 14,318,419 megawatt-hours in 2025, according to final EIA-based plant data. South Dakota utilities sold 13.813 million megawatt-hours to customers during the year on EIA's preliminary tally. Niagara's margin was about 505,000 megawatt-hours, far tighter than in 2024. NYPA's Lewiston plant has 13 main generating units, and a modernization program is now upgrading them one by one.
Its engineering also keeps this entry slightly outside the conventional-dam category. Water is taken from the upper Niagara River above Niagara Falls, carried through conduits and a forebay, then sent through turbines before returning to the lower river. Nothing here means Niagara literally supplied South Dakota. The comparison is about scale. One New York hydroelectric plant produced slightly more energy in 2025 than South Dakota utilities sold statewide.