The Top 10 Imports Into The United States
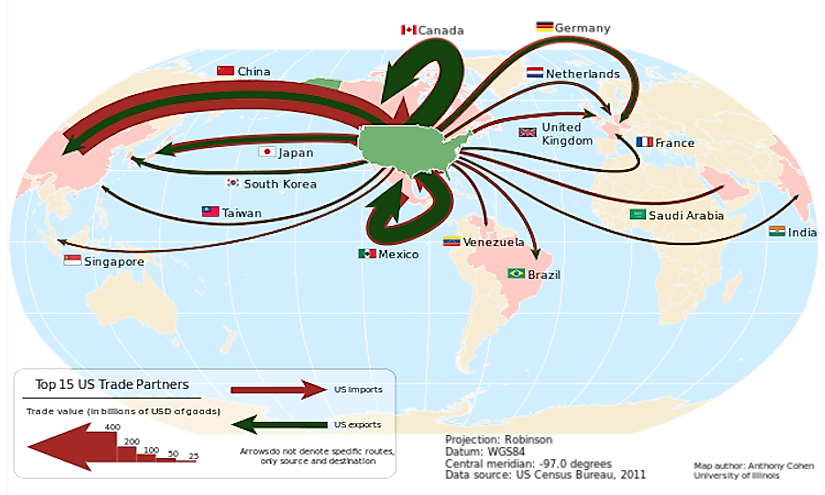
In 2015, the US imported goods worth $2.78 trillion from around the world representing 13.7% of the global imports. In 2016, the figures dropped by 2.4% to stand at $2.252 trillion. The top 10 imports to the US accounted for 2/3 or 66.8% of all imports from around the world. About 45.7% of all imports to the US in 2016 originated from the Asian countries, while the North American partners provided 25.8% of import sales to the country. European countries supplied 21.5% of all imports while imports from Latin America and the Caribbean excluding Mexico represents the smallest portion of suppliers to the US. The US with a population of 324 million people having imports of $2.252 trillion in 2016 represents about $6,900 worth of product demand for every citizen in the country.
The Top 3 Imports Into The US
Electronic Equipments
In 2015, the US imported electronic equipment worth $332.9 billion, which was the largest import value of all the products entering the country, while in 2016, the country imported electronic equipment worth $336 billion which was 14.9% of total imports. The phone systems and devices which included Smartphones were worth $102.4 billion and in 2016 the country imports of the same subcategory were worth $104.9 billion. In 2015, Integrated circuits and micro assemblies entering the US were worth $28.8 billion and in 2016 it increased to $30.8 billion. The TV receivers, monitors, and projectors were valued at $26.9 billion in 2015, but dropped to $23.4 billion in 2016. Other electronic equipment imported to the US includes insulated wire and cables, electrical converters and power units, solar power diodes and semiconductors among other electric equipments.
Machinery
In 2015 the US imported machinery valued at $329.3 billion, which was the second largest import value of goods imported to the country and in 2016 its import value was $315 billion accounting for 14% of all imports to the US. Among the products in this subcategory include computers, optical readers which were valued at $81.4 billion in 2015 and in 2016 they were worth 77.7 billion. Turbo-jets imports were valued at $22.2 billion in 2015 and 2016 they were valued at $21.9 billion, printing machinery imported to the US in 2015 were worth $18.3 billion and in 2016 it dropped to $17.3 billion, computer parts and accessories imported in 2015 were worth 17.7 billion and dropped in 2016 to $16.3 billion. Taps, valves and other similar appliances imports in 2015 were worth $15.2 billion and it dropped in 2016 to $13.8 billion, while piston engines imports were valued at $11.3 billion and 2016 they were valued at 11.1 billion. Other products that were included in the subcategory of machinery included liquid pumps and elevators, transmission shafts, gears, clutches, and air or vacuum pumps.
Vehicles
In 2015, total imports of vehicles were valued at $283.8 billion making the third largest import value of goods shipped to the country. In 2016, vehicle imports were worth $285 billion representing12.7% of the total imports in the year. The cars which is in the category of vehicles imported in 2015 were valued at $169.1 billion and in 2016 they were valued at $173.3 billion, whereas the automobiles parts and accessories in 2015 were worth $66.5 billion and in 2016 they were valued at $66.5 billion. Trucks imported to the country in 2015 were valued at $23.5 billion and increased to $25.2 billion in 2016. Other types of vehicles imported into the US included tractors, trailers, motorcycles, Bicycles and other non-motorized cycles, motorcycles parts and accessories, automobiles bodies, and public-transport vehicles.
The Top 10 Imports Into The United States
| Rank | Export Product | Value (in billions of USD) |
|---|---|---|
| 1 | Electronic equipment | $332.9 |
| 2 | Machines, engines, pumps | $329.3 |
| 3 | Vehicles | $283.8 |
| 4 | Fuel | $201.2 |
| 5 | Pharmaceuticals | $86.1 |
| 6 | Medical, technical equipment | $78.3 |
| 7 | Furniture, lighting, signs | $61.2 |
| 8 | Gems, precious metals | $60.2 |
| 9 | Organic chemicals | $52.1 |
| 10 | Plastics | $50.2 |