US Counties With The Longest Life Expectancy
The list of American counties where people live the longest reads less like a public-health report and more like a luxury real-estate brochure. The top three are all Colorado ski country. The rest are wealthy suburbs, tech enclaves, and one town full of nuclear physicists. According to the landmark 2014 county estimates from the University of Washington's Institute for Health Metrics and Evaluation, the longest-lived place in the country was Summit County, Colorado, at 86.83 years, which is not just high by American standards. It beat Andorra and Iceland, the two longest-lived countries on the entire planet that year. A decade later the figures have moved a little, with the pandemic knocking national life expectancy down to 76.4 years in 2021 before it climbed back to about 78.4 by 2023, but the pattern underneath has barely budged. The same handful of place-types keep winning, and the gap between them and the rest of the country is the part nobody puts in the brochure.
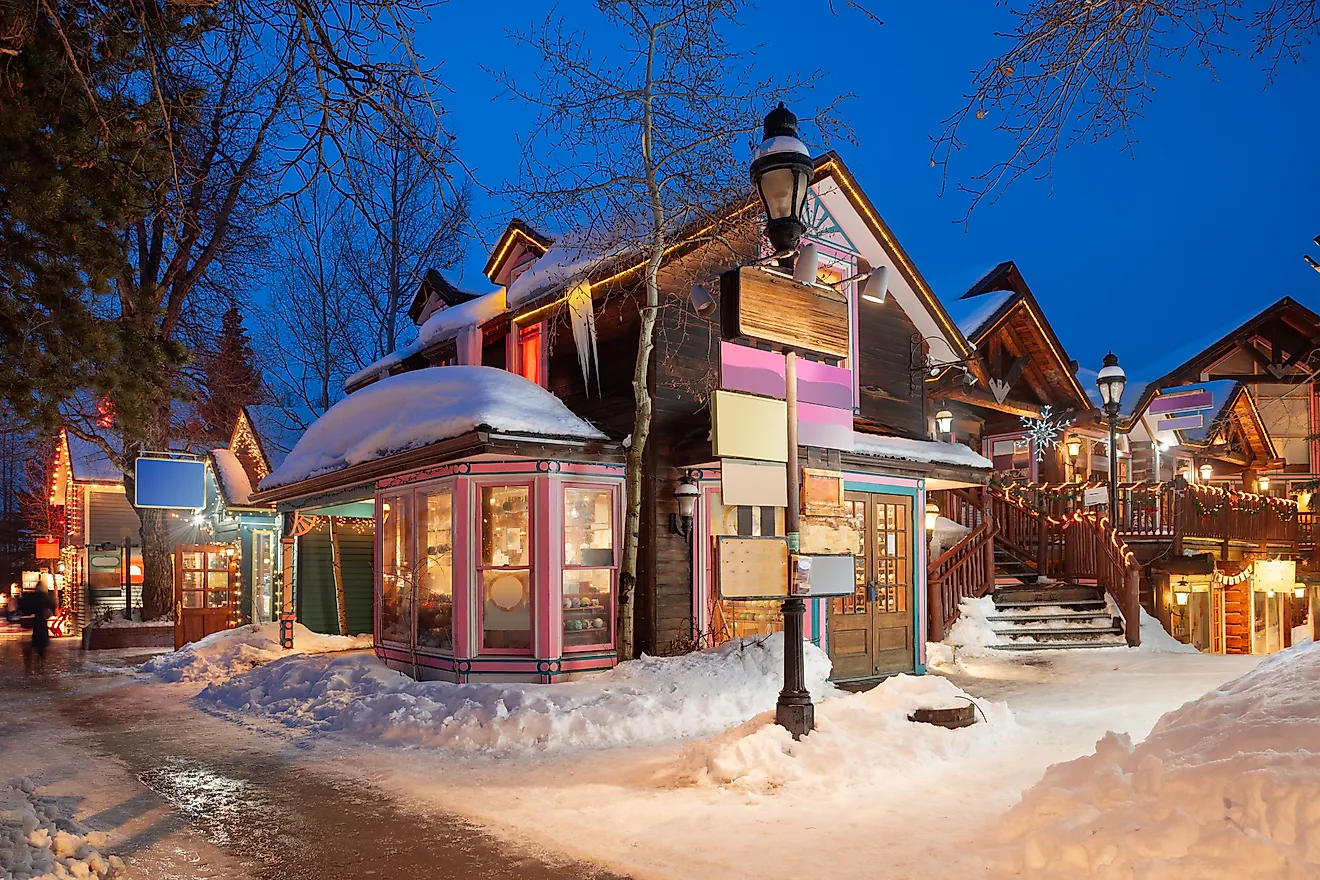
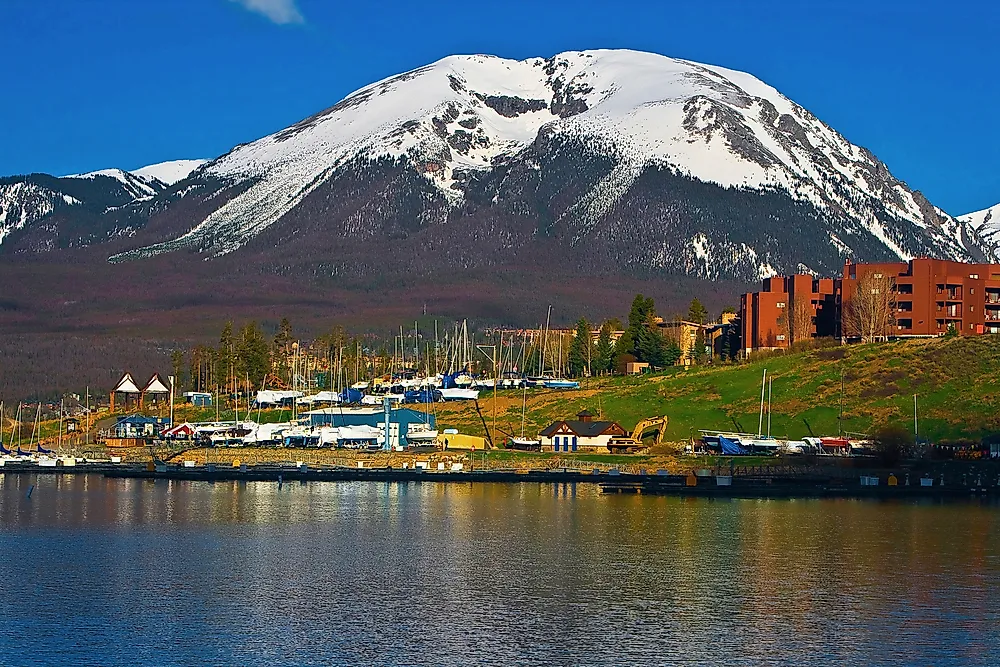
Summit County, Colorado

Summit County sits above 9,000 feet in the heart of Colorado ski country, anchored by Breckenridge, and in the 2014 data its residents could expect 86.83 years, the highest of any county in the nation. Ask the researchers why, and the answer is almost suspiciously tidy: high incomes, high education, easy access to medical care, very low obesity, and a population that treats hiking and skiing as a personality trait. The county also posts some of the lowest cancer-death rates in the country. People love to credit the mountain air, and there is genuine debate about whether moderate altitude is gentler on the heart, but the honest short version is that this is a place full of healthy, affluent, active people, and those things tend to travel together.
Aspen and Vail: Pitkin and Eagle Counties

Just down the road from Summit, the streak continues. Pitkin County, home to Aspen, came in second at 86.52 years, and Eagle County, home to Vail and Beaver Creek, third at 85.94. If you are starting to notice a theme, so did the researchers. These are not merely mountain counties; they are among the wealthiest places in America, the kind of place where the grocery store stocks four kinds of artisanal salt and the median resident owns more technical outerwear than the local ski-rental shop. It is the same recipe as Summit with more zeros on the end: money, education, doctors within reach, and a whole culture organized around being outside.
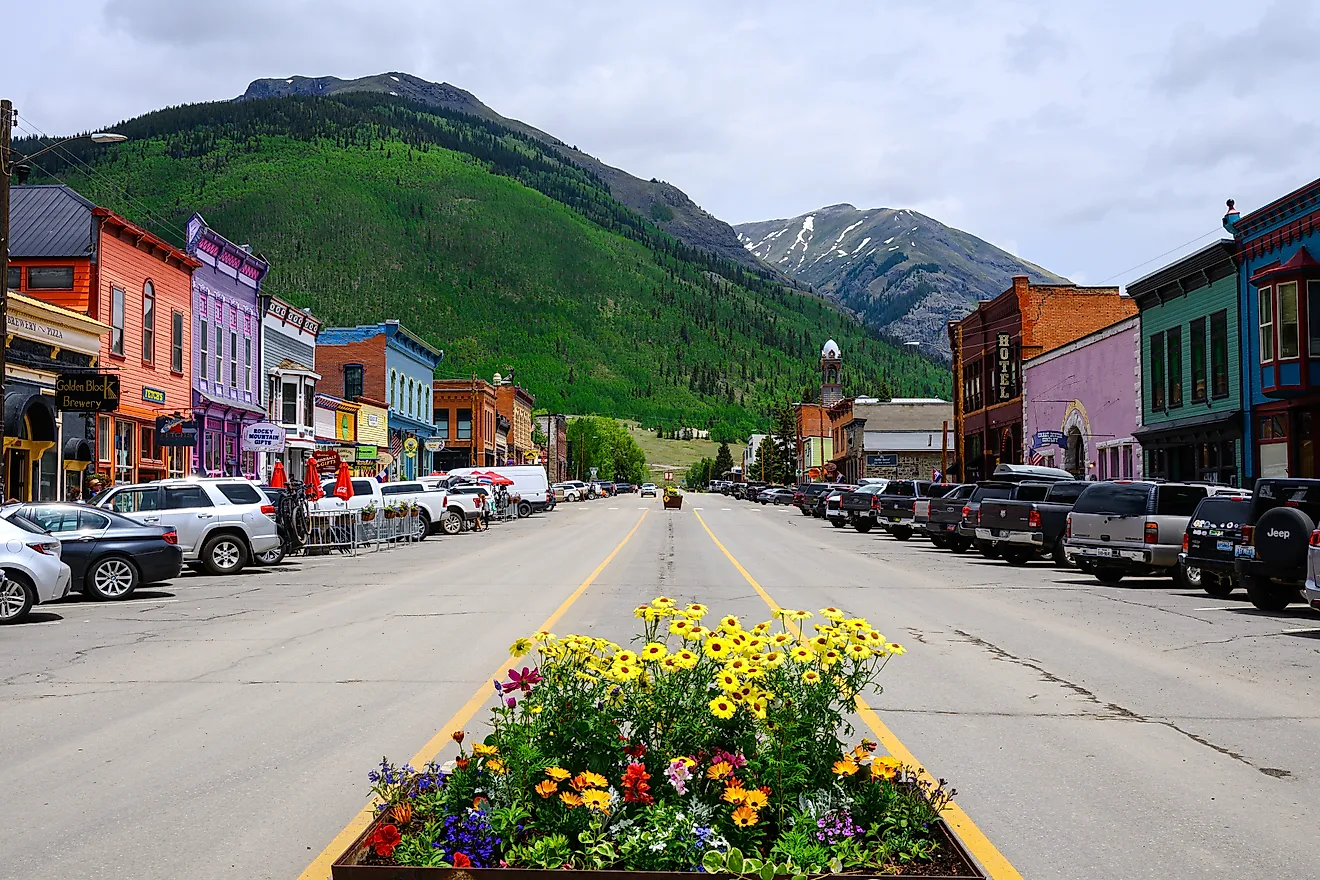
Colorado's Deep Bench

Colorado does not stop at three. The state has 64 counties, and a remarkable number of them turn up near the top of the longevity list: San Miguel County, home to Telluride, along with Douglas, Hinsdale, Ouray, Routt, Grand, Park, and Archuleta, most of them clustered in the high country. It is the most lopsided showing of any single state by a wide margin. The common thread is the one already running through Aspen and Vail, namely mountain-town wealth and an outdoor culture, with a side helping of the thin, dry air that Coloradans will insist is doing something even when the data shrugs.
Marin County, California

Cross the Golden Gate Bridge north out of San Francisco and you reach Marin County, which logged 83.80 years and has been a fixture near the top of these lists for decades. Marin is one of the wealthiest counties in California, with the low population density, organic-everything grocery culture, and easy reach of top hospitals that the longevity formula rewards. Its women in particular are among the longest-lived in the United States, though the old claim that they are the longest-lived on Earth does not hold up, since women in Hong Kong and Japan comfortably outlast them. By American standards, though, Marin is doing extremely well.
Los Alamos, New Mexico, and Teton County, Wyoming

Two of the most telling entries are not ski resorts at all. Los Alamos County, New Mexico, built around the national laboratory where the atomic bomb was designed, is routinely the highest-income and most highly educated county in the United States, a town so thick with PhDs that its longevity almost reads like a footnote to its income bracket. Teton County, Wyoming, home to Jackson Hole, is by some measures the wealthiest county in the country per capita. Neither place has a secret. They have what every county on this list has: money, education, and the health care and habits that tend to come bundled with them.
The Washington Suburbs: Fairfax and Loudoun, Virginia

The pattern even reaches the swamp. Fairfax County and Loudoun County, the affluent Virginia suburbs of Washington, DC, both rank high, powered by the steady, well-insured, well-paid economy of the federal government and the contractors who orbit it. Loudoun has spent years near the top of the list of highest-median-income counties in the country. It is not glamorous the way Aspen is, but the underlying ingredients, stable high incomes, good schools, and excellent hospitals, are identical. Longevity, it turns out, does not care whether your money comes from skiing or from federal procurement.
The Honest Outliers

A few entries break the rich-and-outdoorsy mold and are worth pausing on. Presidio County, Texas, a poor, remote, heavily Mexican-American county on the border, ranks far higher than its income alone would predict. That is the Hispanic Paradox, a well-documented and still not fully explained pattern in which Hispanic Americans, and Mexican Americans especially, tend to outlive wealthier white Americans despite lower incomes and less access to care. The two Aleutian county-equivalents in Alaska also score high, but for a stranger reason: their populations are dominated by young, working-age fish-processing crews, many of them Asian American, the group with the longest life expectancy in the country, and there are very few elderly residents to pull the average down. Same statistic, completely different story.
So What Actually Buys the Extra Years?
Strip away the scenery and the answer is uncomfortably consistent: money, education, and access to good medical care, plus the lower obesity rates and higher physical activity that tend to follow them. Researchers call these the social determinants of health, and in the United States they line up with geography almost too neatly. The flip side is the part the brochure leaves out. In the same 2014 data, the shortest-lived county in the country was Oglala Lakota County, South Dakota, on the Pine Ridge Reservation, at 66.81 years, a gap of more than 20 years from Summit County. Comparably low life expectancies turned up across Appalachia, the Deep South, and other Native American reservations, reflecting entrenched poverty, limited access to health care, and, for tribal communities, generations of documented injustice. The researchers who built the dataset called a gap that size, in the country that spends the most on health care on Earth, unacceptable.
The Full Ranking (2014 Estimates)
Here is the top of the list from the 2014 county estimates, with each county's 1980 figure alongside to show how much ground was gained in a generation. These remain the standard reference numbers for this question, with two caveats: they predate the pandemic, and counties with tiny populations, such as Billings County and the two Aleutian areas, carry wide margins of error, so their exact rank is far shakier than the Colorado leaders'.
| Rank | County and State | 2014 life expectancy (years) | 1980 life expectancy (years) |
|---|---|---|---|
| 1 | Summit County, Colorado | 86.83 | 79.18 |
| 2 | Pitkin County, Colorado | 86.52 | 78.81 |
| 3 | Eagle County, Colorado | 85.94 | 77.21 |
| 4 | Billings County, North Dakota | 84.04 | 79.44 |
| 5 | Marin County, California | 83.80 | 75.66 |
| 6 | San Miguel County, Colorado | 83.73 | 77.58 |
| 7 | Fairfax County, Virginia | 83.73 | 76.65 |
| 8 | Aleutians West Census Area, Alaska | 83.73 | 70.77 |
| 9 | Aleutians East Borough, Alaska | 83.73 | 70.77 |
| 10 | Presidio County, Texas | 83.72 | 75.27 |
| 11 | Douglas County, Colorado | 83.72 | 76.89 |
| 12 | Hinsdale County, Colorado | 83.66 | 76.76 |
| 13 | Los Alamos County, New Mexico | 83.49 | 78.22 |
| 14 | Teton County, Wyoming | 83.46 | 76.35 |
| 15 | Collier County, Florida | 83.43 | 74.48 |
The Bottom Line
If there is a lesson in the longevity map, it is not that you should go buy a place in a ski town, although it apparently would not hurt. It is that in the United States, how long you live is bound up tightly with where you live and how much that place has. The counties at the top did not stumble into an extra two decades of life. They have the incomes, the schools, the hospitals, and the time to spend on a trail. The numbers are a few years out of date now, and the pandemic reshuffled the national picture, but the shape of the thing has held for decades. Longevity in America turns out to be less a personal achievement than a postal code.