Countries By Life Expectancy
When children are born, their parents or society expect them to live as long as possible. However, the number of years a person can live depends on their exposure to risks, accidents, diseases, birth events (complications at birth), and the general life expectancy of the society they are born into.
According to the United Nations, the global average life expectancy is 72.6 years. However, women have higher life expectancy than men, despite their higher morbidity rate. Today’s global average life expectancy is higher than any other nation in 1950. Norway, which had the best health care system, had a life expectancy of 72.3 years in 1950. Over the last seven decades, the global average life expectancy has increased by about 25 years. People from all world regions now live a little longer than they did 70 years ago.
However, the average life expectancies of the populations of countries continue to vary widely across the world from 89.4 years for Monaco to 53.25 for Afghanistan. Several factors like the status of economic wellbeing of the nation, living standards, healthcare facilities, education, health behaviors of the population, etc., influence life expectancy.
This article discusses how the life expectancy varies across the world and which countries have the lowest and highest life expectancies and why.
What Is Life Expectancy?
Life expectancy is the average number of years that a person in a given population is expected to live after attaining “X” years. Mostly, the base age (age X) selected for determining the life expectancy of an individual is 0.0 years. That is, the years a person is expected to live immediately they are born. However, for policy analysis, such as determining an individual’s years of Social Security and Medicare benefits, base ages such as 65 or 75 are often used.
Although life expectancy is the age a person is expected to be at the point of his/her death, not everyone will die at the indicated age even if the mortality pattern in the society remains constant. Some people may die earlier or later since exposure to risks leading to death does not remain uniform in one’s lifetime. Thus, life expectancy is the average years and not the actual years a person is expected to live.
Countries With Life Expectancy Of Over 80 Years
|
Rank |
Country |
Life Expectancy In years |
|---|---|---|
|
1 |
Monaco |
89.40 |
|
2 |
Singapore |
86.19 |
|
3 |
Japan |
84.65 |
|
4 |
San Marino |
83.68 |
|
5 |
Canada |
83.62 |
|
6 |
Iceland |
83.45 |
|
7 |
Andorra |
83.23 |
|
8 |
Israel |
83.15 |
|
9 |
Switzerland |
83.03 |
|
10 |
Malta |
83.00 |
|
11 |
Australia |
82.89 |
|
12 |
South Korea |
82.78 |
|
13 |
Luxembourg |
82.78 |
|
14 |
Italy |
82.67 |
|
15 |
Sweden |
82.60 |
|
16 |
France |
82.39 |
|
17 |
Liechtenstein |
82.36 |
|
18 |
Norway |
82.35 |
|
19 |
New Zealand |
82.33 |
|
20 |
Spain |
82.21 |
|
21 |
Austria |
82.07 |
|
22 |
Netherlands |
81.95 |
|
23 |
Belgium |
81.65 |
|
24 |
Slovenia |
81.61 |
|
25 |
Finland |
81.55 |
|
26 |
Denmark |
81.45 |
|
27 |
Ireland |
81.45 |
|
28 |
Germany |
81.30 |
|
29 |
United Kingdom |
81.30 |
|
30 |
Portugal |
81.29 |
|
31 |
Greece |
81.28 |
|
32 |
United States |
80.43 |
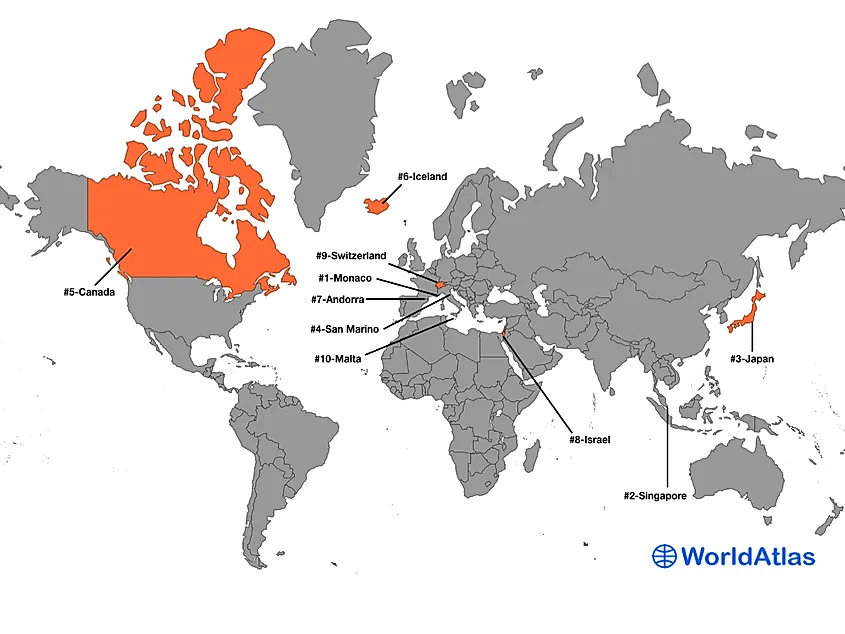
Over 100 countries have a higher life expectancy than the global average. Over the years, most countries have achieved improved health care systems, leading to an increase in average life expectancy. 32 countries have a life expectancy of at least 80 years, the majority of which are European countries. Monaco, a city state and microstate along the French Riviera in Western Europe has the highest life expectancy of 89.4 years. It is followed by Singapore, a city-state in Southeast Asia with a life expectancy of 86.19. The next three positions are occupied by Japan (84.65), San Marino (83.68), and Canada (83.62). The United States ranks 32nd with a life expectancy of 80.43.
10 Countries With Highest Life Expectancy
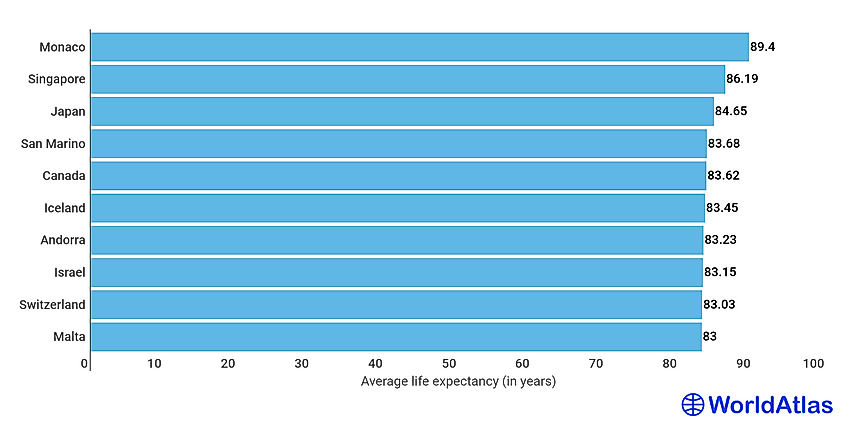
Life expectancy is highest in most of the world’s wealthiest countries. Of the 32 countries with life expectancy of more than 80 years, majority are in Europe. Some Singapore, Japan, Israel, and South Korea are in Asia, Canada and the United States are in North America, and Australia and New Zealand are in Oceania. These countries have some of the best health care systems, supported by strong governmental policies on health, advanced medicine, and improved nutrition. Besides health care, the high standard of living and provision of standard education is also responsible for the high life expectancy in these countries. In some Asian countries like Japan, regular physical activities and healthy diets also contribute to the high life expectancy.
Countries With Life Expectancy Below 65 Years
|
Rank |
Country |
Life Expectancy in years |
|---|---|---|
|
1 |
Afghanistan |
53.25 |
|
2 |
Central African Republic |
55.07 |
|
3 |
Somalia |
55.32 |
|
4 |
Mozambique |
56.49 |
|
5 |
South Sudan |
58.60 |
|
6 |
Chad |
58.73 |
|
7 |
Lesotho |
58.90 |
|
8 |
Eswatini |
59.13 |
|
9 |
Niger |
59.70 |
|
10 |
Sierra Leone |
60.19 |
|
11 |
Nigeria |
60.87 |
|
12 |
Congo, Democratic Republic of the |
61.43 |
|
13 |
Congo, Republic of the |
61.69 |
|
14 |
Angola |
61.71 |
|
15 |
Cote d'Ivoire |
61.80 |
|
16 |
Benin |
61.82 |
|
17 |
Mali |
62.01 |
|
18 |
Cameroon |
62.79 |
|
19 |
Zimbabwe |
62.83 |
|
20 |
Burkina Faso |
63.06 |
|
21 |
Guinea-Bissau |
63.26 |
|
22 |
Guinea |
63.53 |
|
23 |
Senegal |
63.83 |
|
24 |
Mauritania |
64.86 |
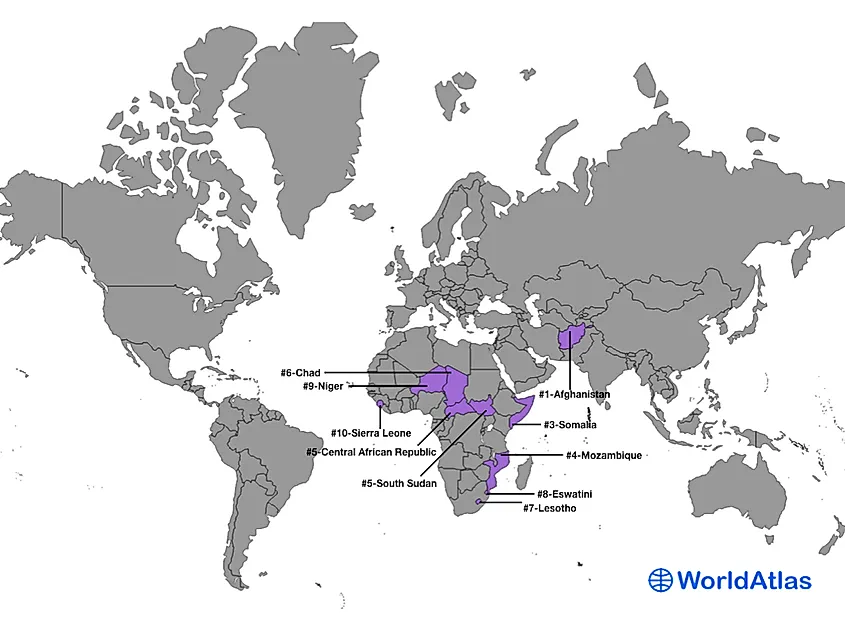
Most of the countries with the lowest life expectancies are in Africa. 24 countries have life expectancy of less than 65 years. 23 of the 24 countries are in Africa. Afghanistan, the only country from Asia among these 24 countries, has the lowest life expectancy in the world of only 53.25 years.
Nigeria, Sierra Leone, and Lesotho have the world’s lowest life expectancies at 54 years. North African countries like Algeria (77.79), Tunisia (76.57), and and Morocco (73.56) have the highest life expectancies in Africa. These North African countries have allocations for their health care systems, with health interventions that benefit the population, leading to higher life expectancies than Sub-Saharan African countries.
10 Countries With Lowest Life Expectancy
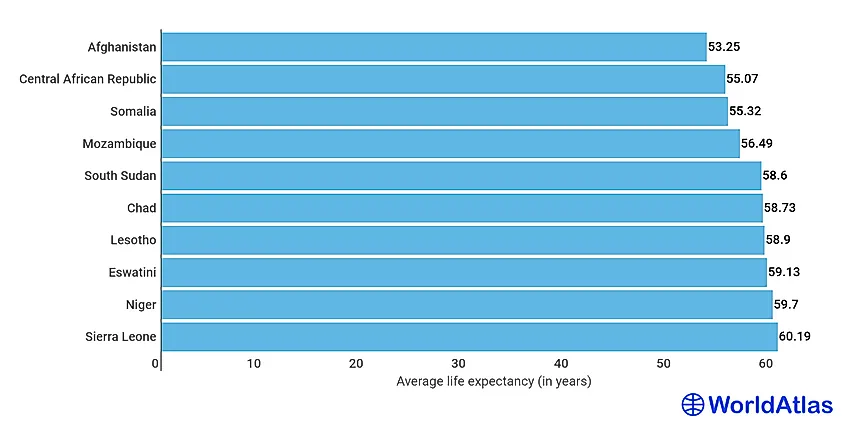
Most African countries and some developing countries globally have lower life expectancies for several reasons. However, the major contributing factor is inadequate access to healthcare. Most households have low incomes or financial resources to access proper healthcare. Besides access to healthcare, widespread of diseases such as HIV, cancer, malaria, and diabetes affect the quality of life and life expectancy in most African xountries.
In Afghanistan, apart from lack of adequate health care and malnutrition, constant conflicts, and wars contribute to high death rates and lower life expectancy.
Calculating Life Expectancy
Life expectancy is estimated by predicting an individual’s survival probability, based on trends of the age-specific mortality rates. Estimating the age-specific mortality rate involves counting the number of deaths within a specific age range at a given time then dividing by the total number of people of the same age range who are alive at a given point within the same interval. For instance, the number of people aged 20-25 years who died in 2010 divided by the number of people aged 20-25 who are alive in 2020.
The fraction obtained above is used to calculate a “life table” which shows the evolving survival probabilities and life expectancies by age. There are two categories of life expectancy; cohort and period life expectancy. Cohort life expectancy is the mean life length of all individuals born in a specific year. Period life expectancy is the average life length of all individuals born in a specific year assumed to be exposed to observed mortality rates at a given time.
Why Measure Life Expectancy?
Life expectancy is an important aspect of demography. It highlights the characteristics and future trends of a given population. It is one of the tools policymakers use in measuring a nation’s Human Development Index. Countries with higher life expectancies score higher HDI than countries with lower life expectancies. Apart from HDI, it also helps in describing an area’s physical quality of life. Populations with high average life expectancies are assumed to be enjoying better life because they have access to essential facilities, like hospitals.
Life expectancy also helps in implementing social support programs such as pension and social security funds. Knowing future trends in life expectancy enables governments to forecast the number of recipients likely to benefit and the amount to allocate for these social programs. Health experts can also consider life expectancy when choosing a health intervention strategy.
|
Rank |
Country |
Life Expectancy in years |
|---|---|---|
|
1 |
Monaco |
89.40 |
|
2 |
Singapore |
86.19 |
|
3 |
Japan |
84.65 |
|
4 |
San Marino |
83.68 |
|
5 |
Canada |
83.62 |
|
6 |
Iceland |
83.45 |
|
7 |
Andorra |
83.23 |
|
8 |
Israel |
83.15 |
|
9 |
Switzerland |
83.03 |
|
10 |
Malta |
83.00 |
|
11 |
Australia |
82.89 |
|
12 |
South Korea |
82.78 |
|
13 |
Luxembourg |
82.78 |
|
14 |
Italy |
82.67 |
|
15 |
Sweden |
82.60 |
|
16 |
France |
82.39 |
|
17 |
Liechtenstein |
82.36 |
|
18 |
Norway |
82.35 |
|
19 |
New Zealand |
82.33 |
|
20 |
Spain |
82.21 |
|
21 |
Austria |
82.07 |
|
22 |
Netherlands |
81.95 |
|
23 |
Belgium |
81.65 |
|
24 |
Slovenia |
81.61 |
|
25 |
Finland |
81.55 |
|
26 |
Denmark |
81.45 |
|
27 |
Ireland |
81.45 |
|
28 |
Germany |
81.30 |
|
29 |
United Kingdom |
81.30 |
|
30 |
Portugal |
81.29 |
|
31 |
Greece |
81.28 |
|
32 |
United States |
80.43 |
|
33 |
Bahrain |
79.67 |
|
34 |
Qatar |
79.58 |
|
35 |
Chile |
79.57 |
|
36 |
Cyprus |
79.51 |
|
37 |
Czechia |
79.50 |
|
38 |
Panama |
79.47 |
|
39 |
Costa Rica |
79.41 |
|
40 |
Cuba |
79.41 |
|
41 |
United Arab Emirates |
79.37 |
|
42 |
Albania |
79.23 |
|
43 |
Kuwait |
78.90 |
|
44 |
Saint Lucia |
78.71 |
|
45 |
Lebanon |
78.53 |
|
46 |
Poland |
78.53 |
|
47 |
Barbados |
78.31 |
|
48 |
Uruguay |
78.19 |
|
49 |
Brunei |
78.14 |
|
50 |
Paraguay |
78.13 |
|
51 |
Argentina |
78.07 |
|
52 |
Slovakia |
78.07 |
|
53 |
Dominica |
77.96 |
|
54 |
Algeria |
77.79 |
|
55 |
Ecuador |
77.76 |
|
56 |
Sri Lanka |
77.75 |
|
57 |
Bosnia and Herzegovina |
77.74 |
|
58 |
Estonia |
77.63 |
|
59 |
Antigua and Barbuda |
77.55 |
|
60 |
Montenegro |
77.51 |
|
61 |
Thailand |
77.41 |
|
62 |
Tonga |
77.29 |
|
63 |
Georgia |
77.25 |
|
64 |
Croatia |
76.97 |
|
65 |
Hungary |
76.95 |
|
66 |
Mexico |
76.94 |
|
67 |
Libya |
76.93 |
|
68 |
Colombia |
76.91 |
|
69 |
Saint Kitts and Nevis |
76.83 |
|
70 |
Mauritius |
76.70 |
|
71 |
Maldives |
76.69 |
|
72 |
Oman |
76.64 |
|
73 |
Tunisia |
76.57 |
|
74 |
Serbia |
76.56 |
|
75 |
Solomon Islands |
76.45 |
|
76 |
Saint Vincent and the Grenadines |
76.43 |
|
77 |
Saudi Arabia |
76.40 |
|
78 |
China |
76.31 |
|
79 |
Romania |
76.30 |
|
80 |
Turkey |
75.96 |
|
81 |
Bahamas, The |
75.87 |
|
82 |
Malaysia |
75.87 |
|
83 |
Armenia |
75.86 |
|
84 |
Seychelles |
75.84 |
|
85 |
Jordan |
75.75 |
|
86 |
Latvia |
75.65 |
|
87 |
Lithuania |
75.61 |
|
88 |
Belize |
75.56 |
|
89 |
Jamaica |
75.49 |
|
90 |
Grenada |
75.48 |
|
91 |
Bulgaria |
75.30 |
|
92 |
Vietnam |
75.25 |
|
93 |
El Salvador |
75.11 |
|
94 |
Iran |
75.06 |
|
95 |
Uzbekistan |
75.03 |
|
96 |
Brazil |
74.98 |
|
97 |
Peru |
74.96 |
|
98 |
Samoa |
74.92 |
|
99 |
Trinidad and Tobago |
74.92 |
|
100 |
Honduras |
74.90 |
|
101 |
Vanuatu |
74.87 |
|
102 |
Nicaragua |
74.51 |
|
103 |
Bangladesh |
74.43 |
|
104 |
Marshall Islands |
74.38 |
|
105 |
Palau |
74.38 |
|
106 |
Micronesia, Federated States of |
74.17 |
|
107 |
Belarus |
74.01 |
|
108 |
Egypt |
74.01 |
|
109 |
Syria |
74.01 |
|
110 |
Fiji |
74.00 |
|
111 |
Azerbaijan |
73.88 |
|
112 |
Suriname |
73.57 |
|
113 |
Morocco |
73.56 |
|
114 |
Cabo Verde |
73.47 |
|
115 |
Ukraine |
73.18 |
|
116 |
Iraq |
72.90 |
|
117 |
Indonesia |
72.82 |
|
118 |
Guatemala |
72.63 |
|
119 |
Dominican Republic |
72.28 |
|
120 |
Kazakhstan |
72.25 |
|
121 |
Venezuela |
72.22 |
|
122 |
Malawi |
72.16 |
|
123 |
Moldova |
72.16 |
|
124 |
Russia |
72.16 |
|
125 |
Nepal |
72.12 |
|
126 |
Kyrgyzstan |
72.07 |
|
127 |
Korea, North |
71.65 |
|
128 |
Guyana |
71.59 |
|
129 |
Turkmenistan |
71.54 |
|
130 |
Bhutan |
71.50 |
|
131 |
Mongolia |
71.08 |
|
132 |
Togo |
70.99 |
|
133 |
Bolivia |
70.70 |
|
134 |
Philippines |
70.32 |
|
135 |
India |
70.03 |
|
136 |
Tanzania |
69.90 |
|
137 |
Papua New Guinea |
69.86 |
|
138 |
Burma |
69.62 |
|
139 |
Timor-Leste |
69.62 |
|
140 |
Gabon |
69.37 |
|
141 |
Pakistan |
69.37 |
|
142 |
Kenya |
69.32 |
|
143 |
Tajikistan |
69.06 |
|
144 |
Ghana |
69.01 |
|
145 |
Uganda |
68.58 |
|
146 |
Tuvalu |
68.07 |
|
147 |
Ethiopia |
67.90 |
|
148 |
Madagascar |
67.86 |
|
149 |
Nauru |
67.62 |
|
150 |
Kiribati |
67.59 |
|
151 |
Yemen |
67.18 |
|
152 |
Burundi |
67.07 |
|
153 |
Comoros |
66.90 |
|
154 |
Sudan |
66.79 |
|
155 |
Sao Tome and Principe |
66.72 |
|
156 |
Eritrea |
66.51 |
|
157 |
Equatorial Guinea |
66.35 |
|
158 |
Cambodia |
66.27 |
|
159 |
Gambia, The |
66.15 |
|
160 |
Laos |
66.00 |
|
161 |
Zambia |
65.92 |
|
162 |
Namibia |
65.87 |
|
163 |
Haiti |
65.61 |
|
164 |
Rwanda |
65.48 |
|
165 |
Botswana |
65.24 |
|
166 |
Liberia |
65.10 |
|
167 |
South Africa |
65.04 |
|
168 |
Djibouti |
65.00 |
|
169 |
Mauritania |
64.86 |
|
170 |
Senegal |
63.83 |
|
171 |
Guinea |
63.53 |
|
172 |
Guinea-Bissau |
63.26 |
|
173 |
Burkina Faso |
63.06 |
|
174 |
Zimbabwe |
62.83 |
|
175 |
Cameroon |
62.79 |
|
176 |
Mali |
62.01 |
|
177 |
Benin |
61.82 |
|
178 |
Cote d'Ivoire |
61.80 |
|
179 |
Angola |
61.71 |
|
180 |
Republic of the Congo |
61.69 |
|
181 |
Democratic Republic of the Congo |
61.43 |
|
182 |
Nigeria |
60.87 |
|
183 |
Sierra Leone |
60.19 |
|
184 |
Niger |
59.70 |
|
185 |
Eswatini |
59.13 |
|
186 |
Lesotho |
58.90 |
|
187 |
Chad |
58.73 |
|
188 |
South Sudan |
58.60 |
|
189 |
Mozambique |
56.49 |
|
190 |
Somalia |
55.32 |
|
191 |
Central African Republic |
55.07 |
|
192 |
Afghanistan |
53.25 |
|
193 |
North Macedonia |
Data not available |
|
194 |
Palestine |
Data not available |
|
195 |
Vatican City |
Data not available |
Table: Countries By Life Expectancy. Source: CIA
Please note: Data is not available for North Macedonia, Palestine, and Vatican City in the above source.
As per World Bank, the life expectancies of North Macedonia and Palestine are 76 and 74 years, respectively.
Vatican City, the life expectancy is 74 years (men), 81 years (women) according to BBC.


