What is a Thematic Map?
Thematic maps are maps that emphasize a specific subject area or theme connected to a specific geographical area. Unlike general reference maps that show a variety of features, thematic maps focus on a specific feature. Thematic maps use base data only as points of reference and do not show natural features such as boundaries, rivers, cities, or even highways. Instead, if the show these features, they are only used as reference points to make it easy for the users to understand the map. The map emphasizes spatial variation of a number of variations such as climate, population density, and health. Thematic maps may also show the interrelationship of geographical distributions
History
Thematic maps were not developed as maps until the 17th century because there were no accurate maps before then. The development of accurate maps was gradual and even in the 17th century, maps were still of poor quality. Once the maps became accurate enough to display features such as boundaries, cities, and coastlines, the first thematic map was produced by Jodocus Hondius in 1607 that showed the dispersion of major religions. In 1686, a star chart was developed by Edmond Halley, an English astronomer. Later that year he published his first meteorological chart and in 1701 he published the first chart showing lines of magnetic variations. Edmond’s maps were mainly used for navigation. In 1854, John Snow created the first thematic map used for problem analysis. He first mapped London’s neighborhood, then mapped the exact location for the cholera incident. Snow was able to find death cluster around a particular pump and was able to conclude that water from that pump was the cause of cholera.
Designing a Thematic Map
When cartographers are designing a thematic map, there are several factors that they put into consideration. The most important factor is the audience. The map users determine what items to be included on the thematic map in addition to the map’s theme. For instance, a thematic map for political use will have political boundaries. The source data is also important and must be accurate, reliable, and recent. The data can be used in various ways and each must be considered in line with the map’s theme. The mapping can be univariate (one type of data), bivariate (two data sets) or multivariate (more than two data sets).
Types of Thematic Maps
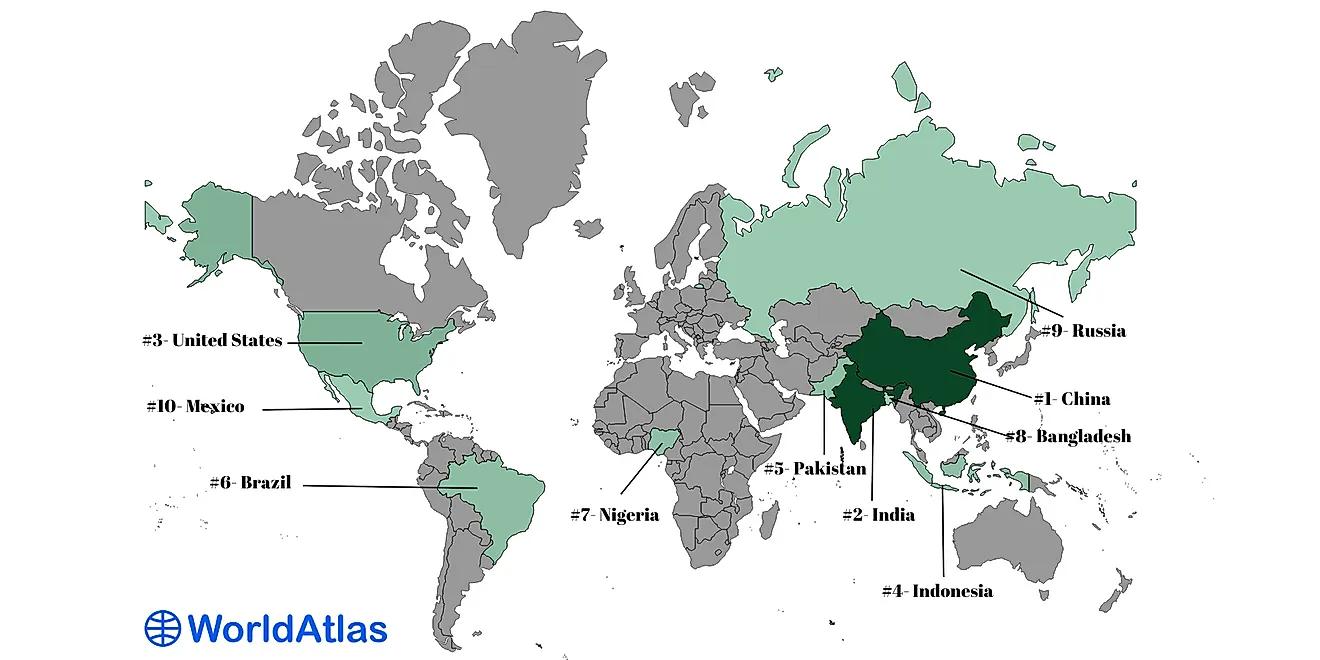
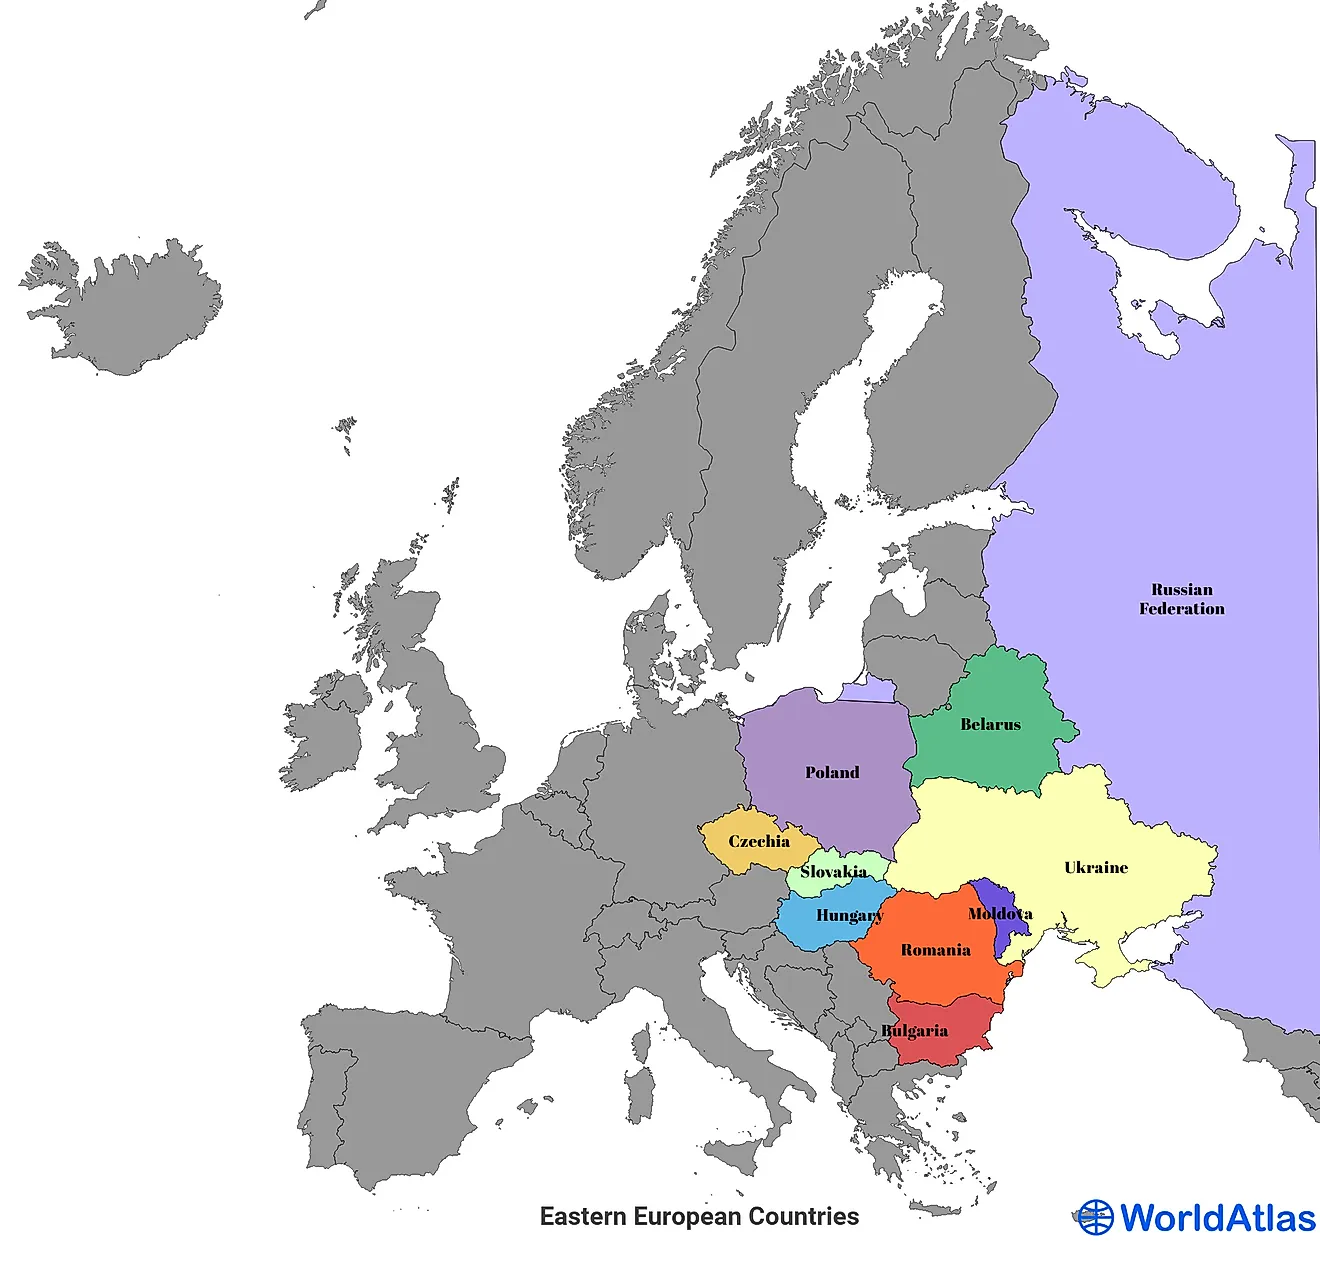
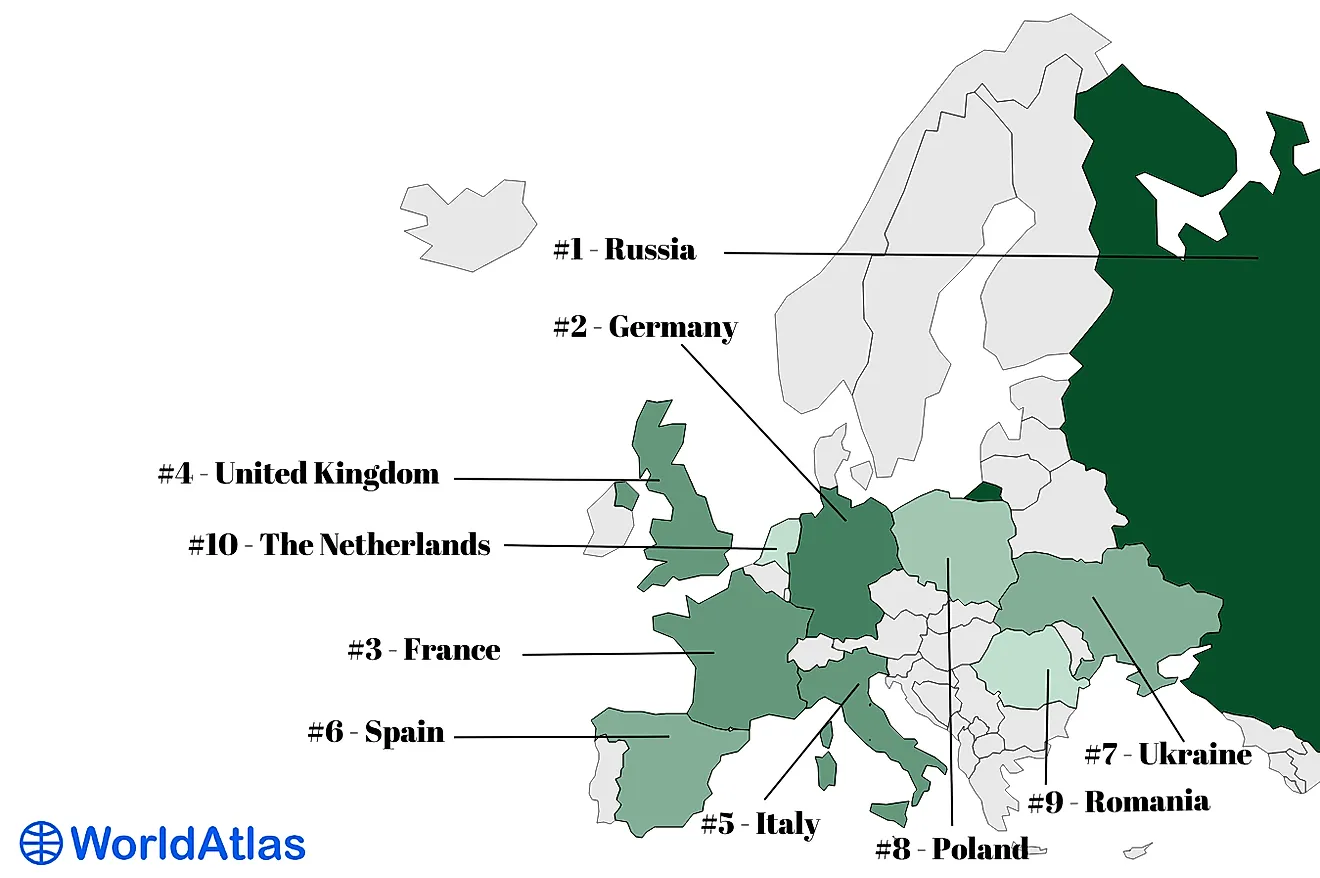
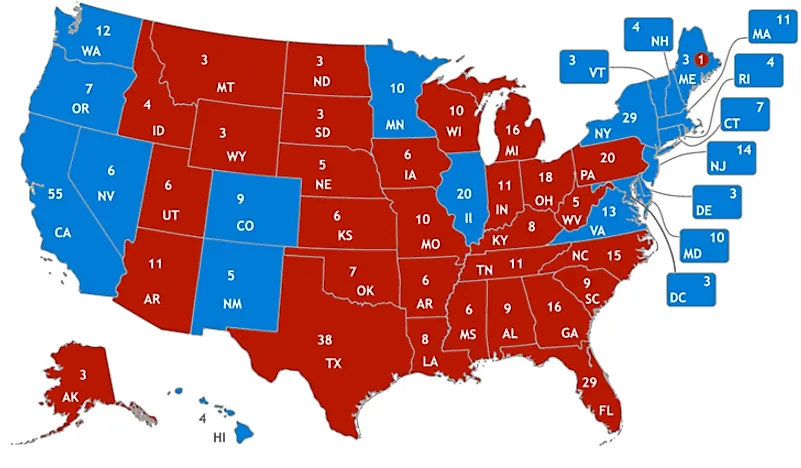
There are five techniques used by cartographers to create thematic maps. The most commonly used technique is choropleth mapping, which shows statistical data that has been aggregated over a predefined region by shading or coloring these regions. It portrays data as color and can show features such as population density. The proportional symbol technique uses symbols to represent data associated with locations such as cities. Another technique is the isarithmic or contour maps which use isolines to depict smooth continuous values such as precipitation level. A dot distribution map can be used to show the presence of a theme and display a spatial pattern. The final technique is dasymetric mapping which is related to choropleth mapping and uses statistics and other information to link areas with the same values instead of administrative boundaries used in choropleth mapping.