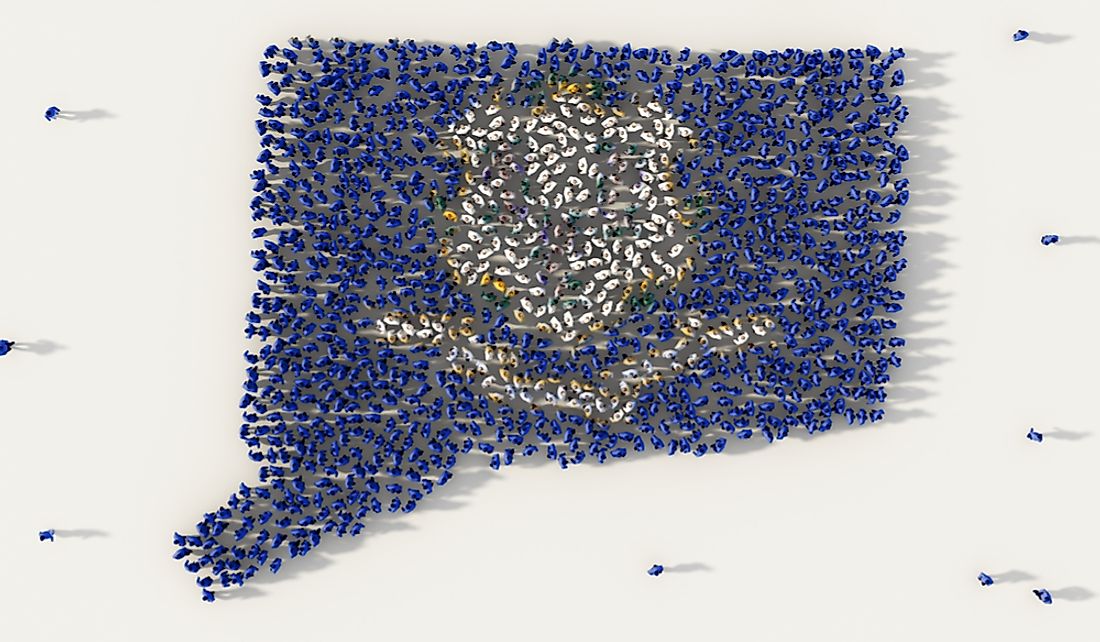
The Ethnic Composition Of The Population Of Connecticut
Connecticut is a US state which is on the southern parts of the New England region. It is surrounded by Long Island Sound, Massachusetts, Rhode Island, and New York. According to the 2010 census, the state had the top median household income, HDI (Human Development Index), and per-capita income in the country. The most highly populated city in Connecticut is Bridgeport, and its capital is Hartford. It is the fourth most densely populated state in the United States and the twenty-ninth most populous state in the country. The state is slowly becoming more ethnically diverse. From 1990 to 2010, the percentage of the population identifying as White dropped from 87% to 77.6%.
History of Connecticut
The first settlers in this region were Dutchmen who developed a small settlement known as Fort Hoop. Over 50% of the state was previously part of the Dutch colony, and during the 1630s the English developed the first main settlement in the territory. Thomas Hooker led a group of settlers from Massachusetts to this place and helped create the colony of Connecticut. Other settlers from Massachusetts established the New Haven and Saybrook colonies. These colonies were merged in 1662 to create a crown colony known as Connecticut.
Demographics of Connecticut
The estimated population of the state by July 1, 2015, was 3,590,886, which was a 0.47% increase since 2010. Connecticut had a growth of approximately 16,789 people from 2010 to 2015 which included a natural growth of about 67,427 people (154,795 deaths and 222,222 births). It also included an increase due to the net-migration of 41,718 individuals. Immigration from other countries resulted in a growth of about 75,991 residents while relocation within the United States created a net loss of approximately 34,273 individuals.
The population is fairly evenly divided between the sexes with males representing 48.4% and females representing 51.6%. When looking at age, 13.8% of the residents are over 65 years old, 24.7% are below 18 years of age, and 6.6% are under five years. In 1790, 97% of the population was classified as rural. The 2010 census classified only 12.3% of the residents as rural.
Ethnic Composition of Connecticut
As of 2010, over 77.6% of the people living in Connecticut identified as White, and this included White Hispanics (6.4%) and non-Hispanic Whites (71.2%). The largest non-White population is the Latinos or Hispanics representing 13.4% of the state's population followed by African Americans of Blacks at10.1%. The state also has smaller populations of Asians (3.8%) and Alaska Natives or American Indians (0.3%). The percentage of Whites in Connecticut decreased from 87% in 1990 to 77.6% in 2010 while that of Blacks increased from 8.3% to 10.1% during the same time period.
Over 11.4% of the residents were foreign-born in 2004. English is the dominant mother-tongue with 81.69% of the residents aged five and above speaking English in 2010. Other languages include Polish (1.2%), French (1.31%), Italian (1.59%), and Spanish (8.42%). The biggest ancestry groups in the state are Italians (19.3%), Irish (17.9%), English (10.7%), German (10.4%), and Polish (8.6%).
Religion of Connecticut
A pew survey of the state in 2014, confirmed that Catholics adherents in the state had dropped from 43% in 2000 to 33% in 2014 while the number of Protestants had increased from 27% to 35%. The number of Jews had decreased from 3.2% in 2000 to 3% in 2014. The number of non-religious individuals grew to 28%. Other smaller denominations in Connecticut include Muslims, Hindu, Buddhist, Mormons, and Eastern Orthodox among others.