GDP By State

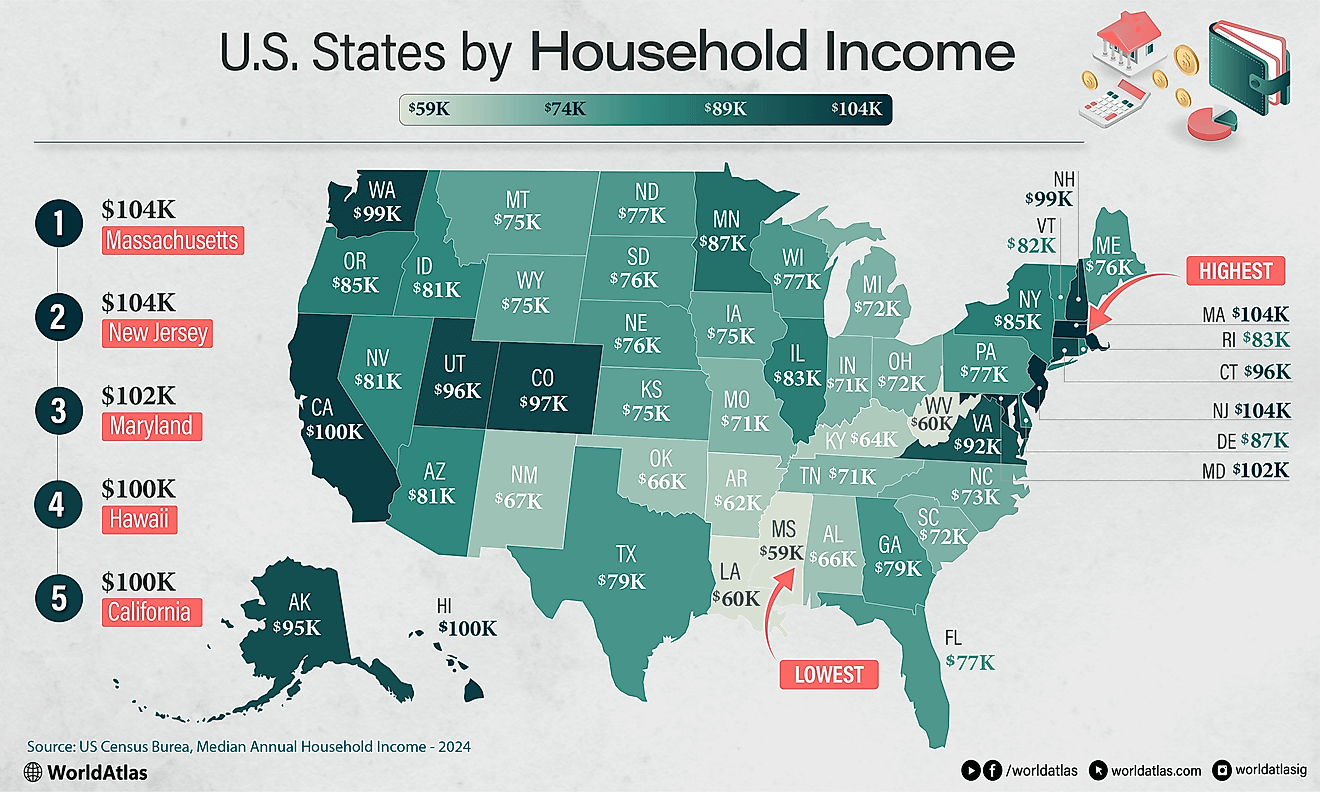
Singular states’ respective roles in achieving nationwide economic outcomes in the United States prove to be a perplexing subject. Resource availability and population are two of the most important factors in determining US states’ relative contributions to national Gross Domestic Product (GDP). According to the US Department of Commerce’s Bureau of Economic Analysis (BEA), the states with the highest absolute GDPs in 2014 were California, New York, and Texas, while Wyoming registered the lowest statewide GDP. The states with the largest real GDP growth in 2014 were North Dakota, Texas, Wyoming, and West Virginia, while the largest declines were seen in Alaska and Mississippi. Per capita real GDP ranged from a high of $66,160 in Alaska to a low of $31,551 in Mississippi, while the nationwide average was $49,469.
Intrastate and Interstate Economics
Where a nation's financial improvement is concerned, certain factors have huge roles in influencing its level of economic advancement, and the contribution of individual regions and administrative areas to GDP ranks high among them. Each state contributes to improvement by influencing the design of the national economy, contributing meaningful assistance through the use of different administrative approaches, and passing regulations which control financial activities. A few approaches incorporate mechanical strategies, such as 100% remote responsibility for international companies who operate in the nation or expense exclusions for various years. State-by-state foreign exchange protocols have to a great degree been normalized nationwide, and these incorporate minimizing import and fare duties, or the giving of liberal fare endowments to aid in the utilization of outside merchandise. In this manner, there is an expanded need for direct cross-outskirt exchange, which then builds a stream of capital, products, and administration to move the nation to a higher phase of monetary action.
Global Perspectives on Domestic GDP Dynamics
Similar interplay between regional contributions to a larger national economy is found in many of the world's leading economies, Singapore included. After Singapore picked up autonomy as a nation, its administration rushed to promote a promising business environment for investors, with expectations of turning the nation into a financial center. They offered impetuses, including a 40% corporate expense on remote international companies, relatively lower than many in the West. Furthermore, they set a low benefit charge at around 17%. Send-out endowments were for the most part given as the administration remunerated the individuals who wandered into exchange, with half of generated expenses financed for some. This supported Singapore's fares, additionally bringing down its expenses which profoundly expanded the engaging quality of neighborhood merchandise to outsiders. US states have by means of similar arrangements permitted the their country to become one of the wealthiest nations, with an astounding GDP per capita of near $50,000, demonstrating a propelled level of monetary improvement.
Sectors Driving GDP Growth in the US Today
US state by state GDP expanded in 48 states and the District of Columbia in 2014. Nondurable product assembling and land rentals were the fastest growing sectors benefiting US economic development, assisting with an overall GDP growth of 2.2% in 2014. Specialized administrative services saw the biggest growth in support of US GDP in 2014. This sector grew 4.2% in 2014 over a 0.7% growth in 2013. Such services were an especially important sector in the New England and Far West states, and added to development in 46 states overall. It was an especially important benefactor to growth in the states of California, Massachusetts, and Utah. Nondurable products assembling grew 4.2% in 2014, in contrast with 1.1% in 2013. In 2014, this industry was the biggest benefactor to development in the Great Lakes area and added to development in 41 states. It made a significant contribution to development in Louisiana and Montana especially. Land and land rentals grew 1.5%in 2014, which was a decrease from its rate of 1.6% in 2013. This industry was the biggest contributor to development in the Southeast area of the country and added to development in 32 states overall. Although mining was not a critical component for the GDP development of the American economy generally, it did assume a key role in a few states. This industry was an extensive patron in the five quickest developing states—North Dakota, Texas, Wyoming, West Virginia, and Colorado. Horticulture, ranger services, angling, and hunting declined in much of the country in 2014. The sector declined most in the Prairie states of South Dakota, Iowa, Nebraska, and North Dakota.
GDP By State
| Rank | State | GDP in millions USD |
|---|---|---|
| 1 | California | 2,305,921 |
| 2 | Texas | 1,641,044 |
| 3 | New York | 1,395,488 |
| 4 | Florida | 838,939 |
| 5 | Illinois | 736,285 |
| 6 | Pennsylvania | 658,290 |
| 7 | Ohio | 576,056 |
| 8 | New Jersey | 551,828 |
| 9 | North Carolina | 481,876 |
| 10 | Georgia | 474,696 |
| 11 | Virginia | 462,861 |
| 12 | Massachusetts | 455,732 |
| 13 | Michigan | 448,243 |
| 14 | Washington | 422,877 |
| 15 | Maryland | 346,857 |
| 16 | Indiana | 318,085 |
| 17 | Minnesota | 317,237 |
| 18 | Colorado | 305,871 |
| 19 | Tennessee | 297,159 |
| 20 | Wisconsin | 289,616 |
| 21 | Arizona | 286,554 |
| 22 | Missouri | 279,835 |
| 23 | Louisiana | 251,672 |
| 24 | Connecticut | 250,569 |
| 25 | Oregon | 212,807 |
| 26 | Alabama | 200,414 |
| 27 | South Carolina | 189,278 |
| 28 | Kentucky | 187,788 |
| 29 | Oklahoma | 183,174 |
| 30 | Iowa | 169,707 |
| 31 | Kansas | 144,407 |
| 32 | Utah | 140,031 |
| 33 | Nevada | 135,038 |
| 34 | Arkansas | 120,035 |
| 35 | Nebraska | 111,007 |
| 36 | Mississippi | 104,753 |
| 37 | New Mexico | 91,885 |
| 38 | Hawaii | 76,171 |
| 39 | West Virginia | 74,296 |
| 40 | New Hampshire | 70,358 |
| 41 | Delaware | 63,404 |
| 42 | Idaho | 63,235 |
| 43 | Alaska | 56,647 |
| 44 | North Dakota | 55,978 |
| 45 | Rhode Island | 54,492 |
| 46 | Maine | 54,324 |
| 47 | South Dakota | 46,169 |
| 48 | Montana | 44,135 |
| 49 | Wyoming | 43,800 |
| 50 | Vermont | 29,312 |
