US States With the Oldest Populations
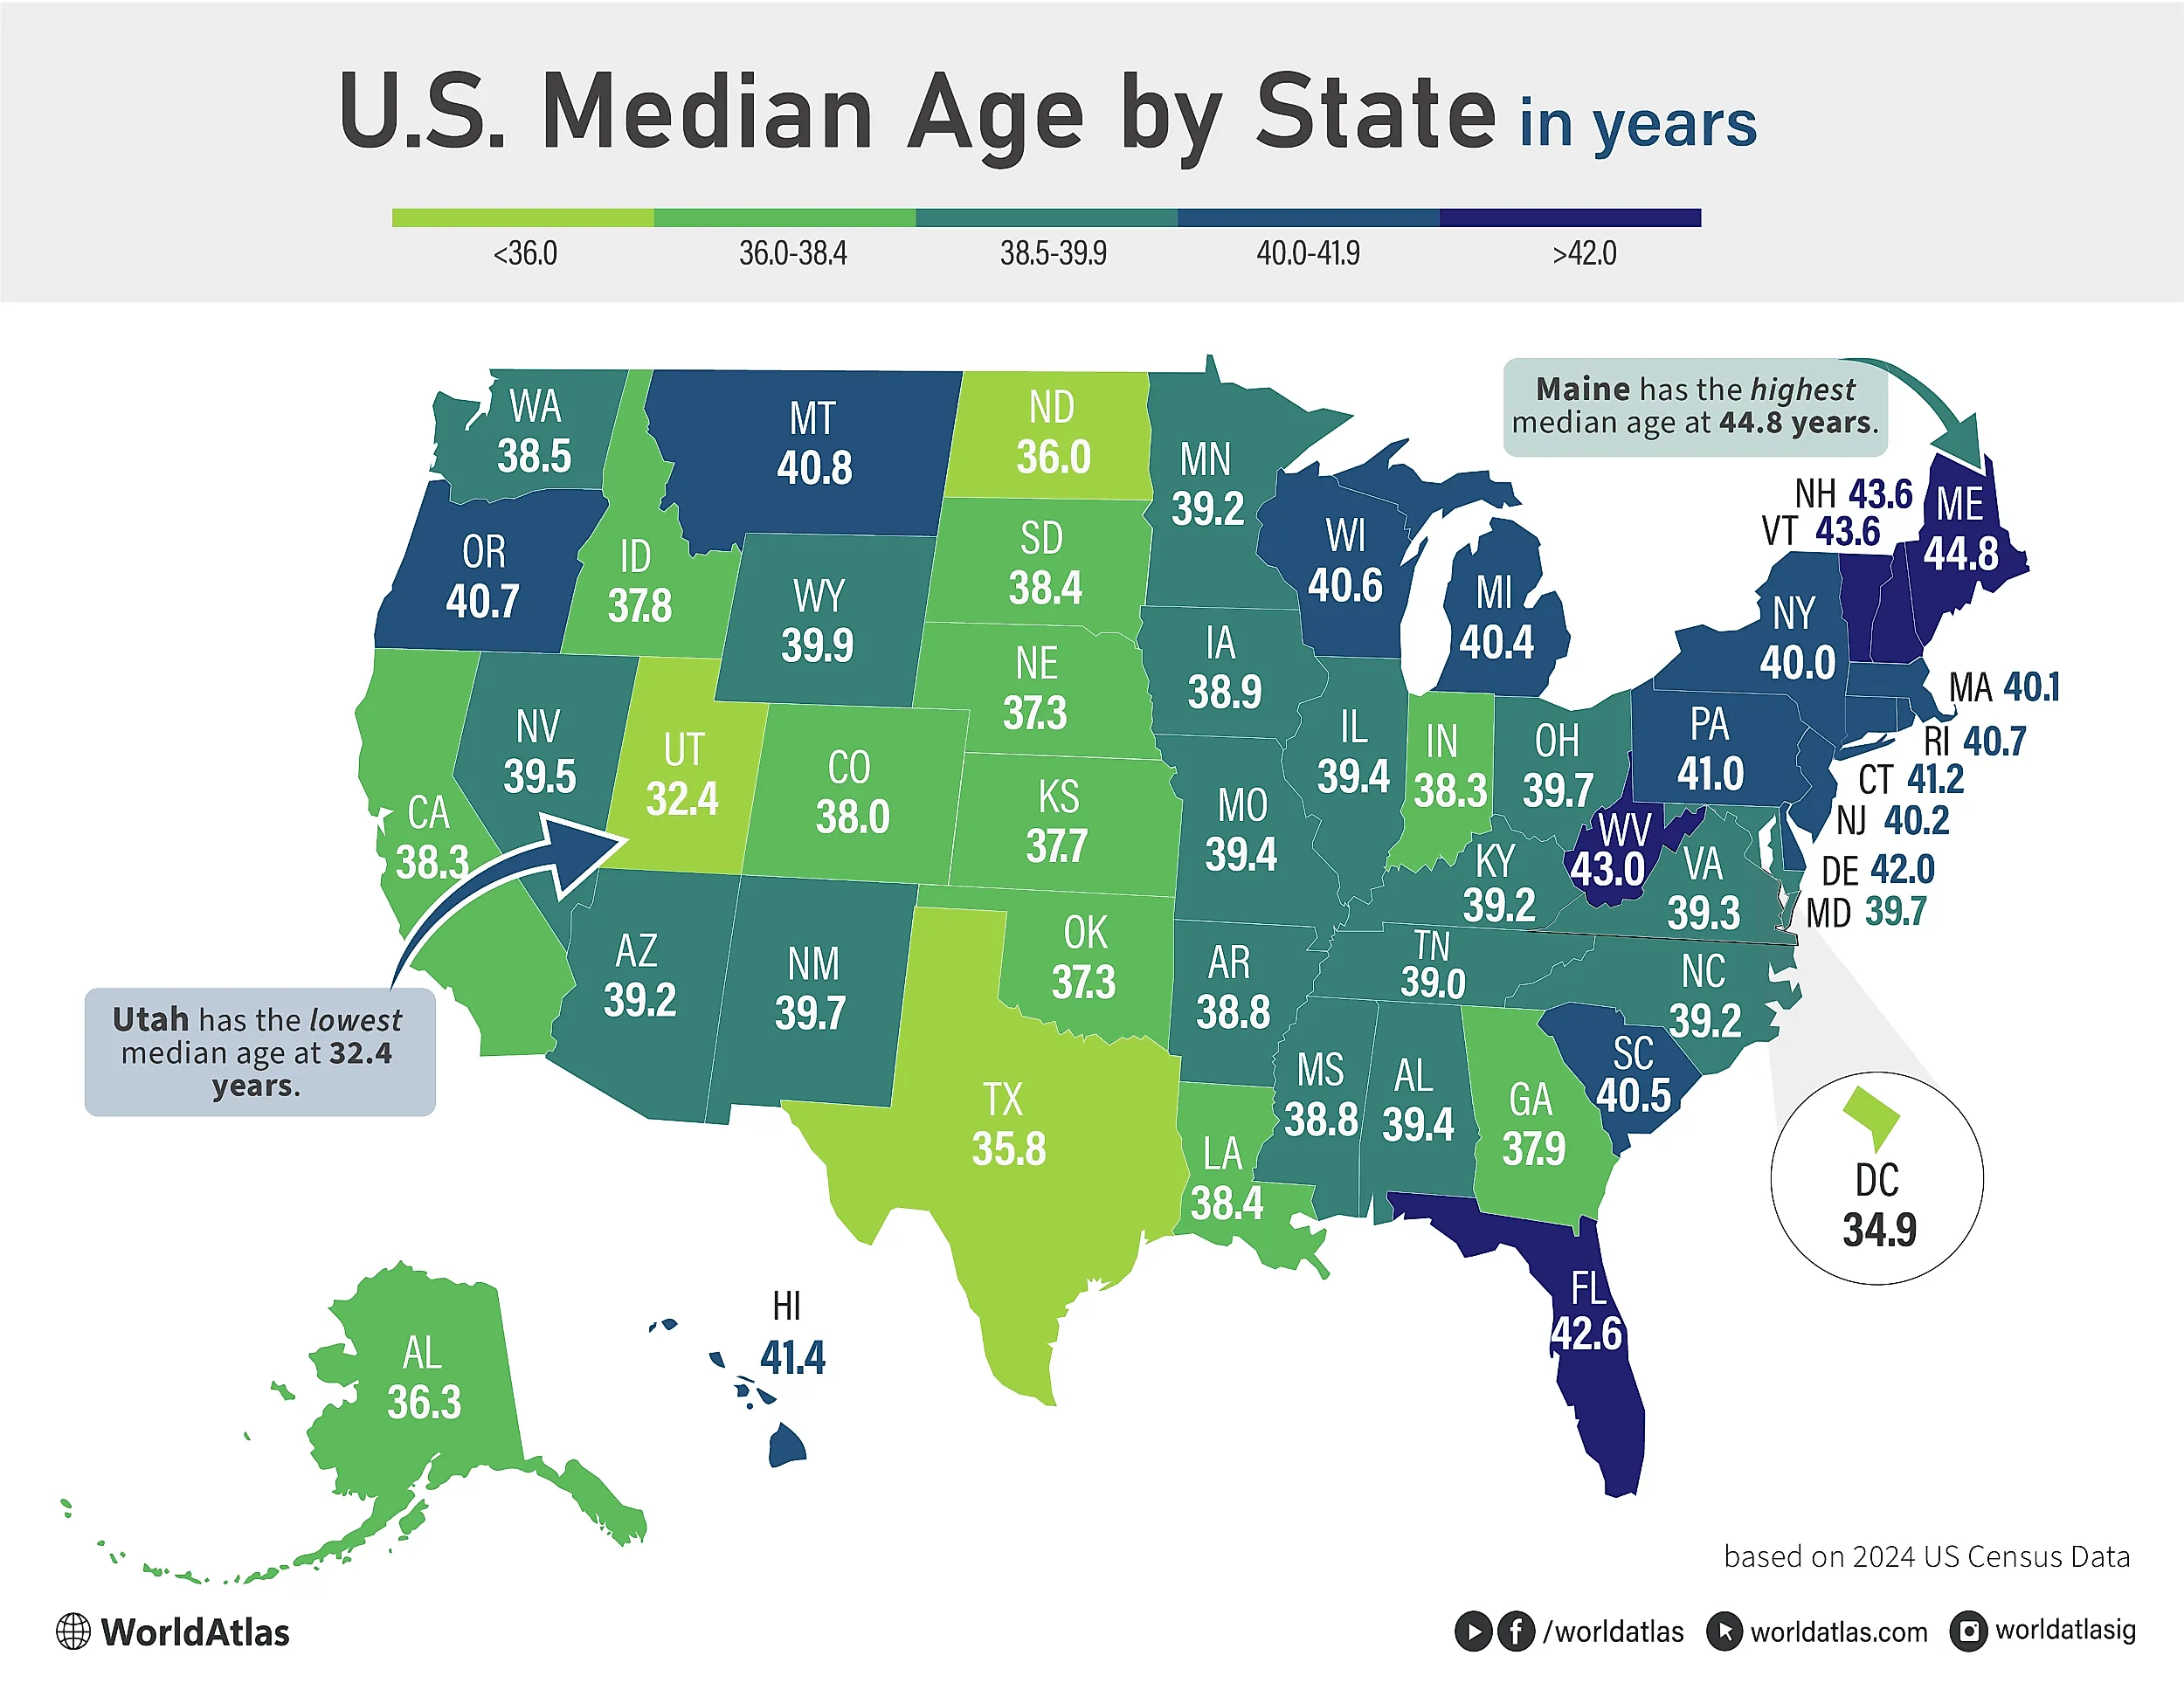
America is getting older, but not evenly. States like Maine, New Hampshire, and Vermont now top the charts, while Florida’s retiree magnetism and slower-growing Northeastern and Appalachian states keep the median high. Others, such as Montana and Oregon, join the list as rurality, out-migration of young adults, and rising longevity reshape populations.
An older age profile boosts demand for healthcare, caregivers, and accessible housing, but squeezes school enrollments and labor supply, straining local budgets. It also shifts politics, consumption, and infrastructure priorities. The question for leaders isn’t just who is oldest, but how to attract families, support seniors, and fund services sustainably.
US States With The Oldest Populations
| Rank | State | Median Age |
|---|---|---|
| 1 | Maine | 44.8 |
| 2 | New Hampshire | 43.6 |
| 2 | Vermont | 43.6 |
| 3 | West Virginia | 43 |
| 4 | Florida | 42.6 |
| 5 | Delaware | 42 |
| 6 | Hawaii | 41.4 |
| 7 | Connecticut | 41.2 |
| 8 | Pennsylvania | 41 |
| 9 | Montana | 40.8 |
| 10 | Oregon | 40.7 |
Click here to view the list of all U.S. states ranked by median age
1. Maine, 44.8 years

Maine has the nation’s highest median age at 44.8. With 1,405,012 residents in 2024, it is the most rural state, sparsely populated at 44 people per square mile. As of 2020, it also has the highest share of people 65+, reflecting slow long-term growth. Recent in-migration has accelerated, 1.8 arrivals for every departure in 2021-2022, yet aging remains pronounced. The state’s coastal tourism, lobstering, shipbuilding, and a growing creative economy center on Portland, while vast forests and small towns dominate inland. Services, housing, and healthcare planning increasingly focus on older Mainers statewide.
2. New Hampshire/Vermont, 43.6 years

New Hampshire and Vermont are tied for the #2 oldest states, each with a median age of 43.6 (behind Maine’s 44.8). Small, rural, and heavily New England in character, both are losing young adults and attracting retirees, driving school enrollments down and healthcare demand up. New Hampshire (1.41M people) couples high incomes with low, broad-based taxes.

Vermont (648k) remains smaller, progressive, and tourism-reliant. Shared challenges include labor shortages, senior housing and transport, and sustaining services on property-tax bases.
3. West Virginia, 43 years

West Virginia is the nation’s No. 3 oldest state, with a median age of 43.0, behind Maine (44.8) and New Hampshire/Vermont (43.6), and just ahead of Florida (42.6). The Mountain State’s aging profile reflects long-term population decline, low immigration, and out-migration of young adults from its rural, Appalachian counties. Health and income challenges compound these trends, increasing demand for healthcare and elder services while shrinking the working-age labor pool. Policymakers are focused on diversifying the economy, retaining graduates, and attracting newcomers to stabilise communities and fund schools, infrastructure, and care locally.
4. Florida, 42.6 years

Florida ranks fourth-oldest among U.S. states, with a median age of 42.6. Its sunny climate, lack of state income tax, and abundant retirement communities draw older Americans, while in-migration after the 2017 hurricanes and pandemic-era relocations sustained growth. Seniors cluster along the coasts and in Central Florida metros, supported by robust healthcare and leisure economies statewide. An older population boosts demand for housing, services, and healthcare workers, yet tightens labor supply. Florida remains the third-most-populous state, so its age profile shapes national politics, healthcare spending, consumer trends, and disaster-preparedness priorities nationwide.
5. Delaware, 42 years

Delaware ranks 5th nationally for median age (42), trailing Florida (42.6) among top-aging states led by Maine, New Hampshire, Vermont, and West Virginia. The Blue Hen State’s older profile reflects steady in-migration of retirees drawn to tax advantages, coastal towns like Rehoboth and Lewes, and proximity to Mid-Atlantic metros. Aging is also shaped by slower population growth downstate and modest birth rates. Implications include rising demand for healthcare and senior housing, age-friendly transportation, and workforce replacement strategies, especially in Sussex and Kent, while urban New Castle County skews somewhat younger.
6. Hawaii, 41.4 years

Hawaii ranks 6th among U.S. states by median age, at 41.4. While younger than top-ranked Maine (44.8) and Florida (42.6), Hawaii’s older profile reflects exceptionally long life expectancy (80.7 years), modest population growth, and a high cost of living that nudges some younger families to the mainland. Two-thirds of residents live on Oʻahu, but the neighbor islands skew older with slower growth and tourism-centric economies. Hawaii’s median age also tops Connecticut (41.2) and Pennsylvania (41), placing it firmly among the nation’s oldest states despite its tropical, high-mobility setting and isolation.
7. Connecticut, 41.2 years

Connecticut ranks 7th among the oldest U.S. states, with a median age of 41.2. As a New England state of 3.6 million people, it sits just behind Delaware (42.0) and Florida (42.6) and slightly ahead of Pennsylvania (41.0). Connecticut’s age profile aligns with its region, where Maine, New Hampshire, and Vermont lead the nation. The state remains densely populated and suburbanized along the New York-Boston corridor, with Hartford as the capital and Bridgeport its largest city. An older population underscores needs in healthcare, housing, and workforce renewal alongside strong educational assets.
8. Pennsylvania, 41 years

Pennsylvania ranks 8th for median age at 41.0, just behind Connecticut (41.2) and ahead of Montana (40.8). The commonwealth’s 13+ million residents span large metros (Philadelphia, Pittsburgh) and wide rural areas, both contributing to an older profile. Pennsylvania has long had a relatively high 65+ share and slower growth, reflecting industrial transition and out-migration of younger adults. Neighboring Delaware (42.0) and retirees pulling to Florida also shape age patterns. Despite aging, Pennsylvania remains economically diverse with healthcare, education, and major logistics hubs anchoring employment and services for an older population.
9. Montana, 40.8 years

Montana ranks 9th for median age at 40.8. The state is the nation’s fourth-largest by area yet only 43rd by population (1,137,233 in 2024) and remains one of the least dense (7.8 people per sq. mile), factors that often skew rural populations older. Its largest city and metro is Billings, with other major cities including Missoula, Great Falls, and Bozeman. On this list, Montana sits just below Pennsylvania (41.0) and just above Oregon (40.7). Tourism is the fastest-growing sector, while agriculture, natural resources, and mining industries anchor the economy overall.
10. Oregon, 40.7 years

Oregon ranks 10th among the nation’s oldest states, overall just behind Montana (40.8) and Pennsylvania (41.0). With 4.27 million residents across 98,381 square miles, the population concentrates in the Portland-Willamette Valley corridor, while vast rural regions are sparsely settled. The Beaver State spans rain-soaked coast and valleys to the high desert east, with mild climates west of the Cascades. Key cities include Portland, Salem, Eugene, Bend, Corvallis, and Medford. Major industries include technology (“Silicon Forest”), timber, agriculture, and tourism, factors shaping where Oregonians live and age statewide.
US States Ranked By Median Age
| Rank | State | Median Age |
|---|---|---|
| 1 | Maine | 44.8 |
| 2 | New Hampshire | 43.6 |
| 2 | Vermont | 43.6 |
| 3 | West Virginia | 43 |
| 4 | Florida | 42.6 |
| 5 | Delaware | 42 |
| 6 | Hawaii | 41.4 |
| 7 | Connecticut | 41.2 |
| 8 | Pennsylvania | 41 |
| 9 | Montana | 40.8 |
| 10 | Oregon | 40.7 |
| 11 | Rhode Island | 40.7 |
| 12 | Wisconsin | 40.6 |
| 13 | South Carolina | 40.5 |
| 14 | Michigan | 40.4 |
| 15 | New Jersey | 40.2 |
| 16 | Massachusetts | 40.1 |
| 17 | New York | 40 |
| 18 | Wyoming | 39.9 |
| 19 | Maryland | 39.7 |
| 20 | New Mexico | 39.7 |
| 21 | Ohio | 39.7 |
| 22 | Nevada | 39.5 |
| 23 | Alabama | 39.4 |
| 24 | Illinois | 39.4 |
| 25 | Missouri | 39.4 |
| 26 | Virginia | 39.3 |
| 27 | Arizona | 39.2 |
| 28 | Kentucky | 39.2 |
| 29 | Minnesota | 39.2 |
| 30 | North Carolina | 39.2 |
| 31 | Tennessee | 39 |
| 32 | Iowa | 38.9 |
| 33 | Arkansas | 38.8 |
| 34 | Mississippi | 38.8 |
| 35 | Washington | 38.5 |
| 36 | Louisiana | 38.4 |
| 37 | South Dakota | 38.4 |
| 38 | California | 38.3 |
| 39 | Indiana | 38.3 |
| 40 | Colorado | 38 |
| 41 | Georgia | 37.9 |
| 42 | Idaho | 37.8 |
| 43 | Kansas | 37.7 |
| 44 | Nebraska | 37.3 |
| 45 | Oklahoma | 37.3 |
| 46 | Alaska | 36.3 |
| 47 | North Dakota | 36 |
| 48 | Texas | 35.8 |
| 49 | District of Columbia | 34.9 |
| 50 | Utah | 32.4 |
US Census numbers for 2024