What Are The Climate Change Indicators?
Since the Industrial Revolution, human activity has led to the emission of a considerable amount of greenhouse gases into the atmosphere. Greenhouse gases such as carbon dioxide, nitrous oxide, and methane have been blamed for the global warming phenomenon, an essential aspect of climate change. Over the last few decades, evidence of climate change has become increasingly compelling. Rainfall and snow patterns are shifting, temperatures are rising, and extreme weather events such as heavy rainstorms are becoming frequent. Climate change indicators are used to track and communicate changes in the Earth’s climate. The indicators represent the trend or state of certain societal and environmental conditions in a given area and over a given period. For example, measurements of temperature in the long-term can be used as an indicator to track and allow scientists and the public to better understand the effects of changes on the Earth’s climate. Climate change indicators include global temperature increase, changes in precipitation, glacier melting, wildfires, and sea ice melting, among others.
Global Temperature
Temperature indicators are based on records from thousands of monitoring stations. According to data compiled so far, average surface temperatures globally have risen at an average rate of 0.15 degrees per decade since 1901.
Change In Precipitation
The global precipitation indicator is based on daily precipitation records from thousands of weather monitoring stations. The indicator is particularly crucial since precipitation can have wide-ranging effects on the ecosystem and human well being. Snowfall, rainfall, and timing of precipitation can affect the amount of groundwater and surface water available for irrigation, drinking, and industry. The factors can also affect the frequency and intensity of flooding and determine the types of plants and animals that can survive in a particular area. On average, annual precipitation has increased since 1901 at an average rate of 0.08 inches per decade. The increase in precipitation is a result of increased temperatures, which lead to more evaporation, and this, in turn, leads to precipitation. Some areas might; however, experience decreased precipitation and drought.
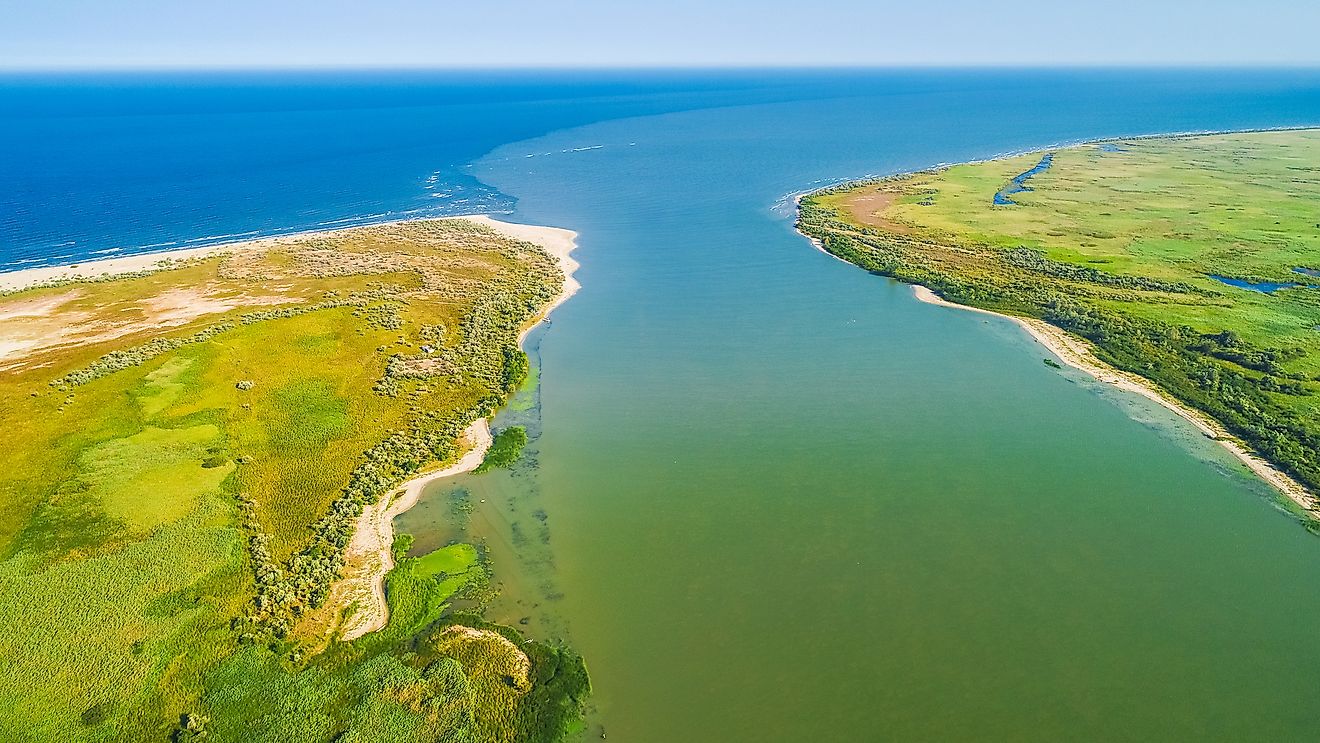
Sea Level

The sea-level change is measured in two ways, relative sea-level change, and absolute sea-level change. Relative sea-level change looks at how ocean levels rise and fall relative to the land in a given area. Absolute sea level refers to the height of the ocean surface above the center of the Earth. With an increase in temperatures, sea levels have also been on the rise. Variation in temperatures can affect the volume of ice and water on land and increase or decrease the amount of water in the ocean. A rise in temperatures can also lead to an expansion of water as it warms up, leading to a higher sea level. Higher sea levels can lead to coastal flooding and erosion of shorelines. The average global sea level rose considerably in the 20th century and accelerated in recent years. The absolute sea level across the world has risen at a rate of 0.06 inches per year from 1880 to 2013. The average sea level, on the other hand, has risen at a rate of 0.11 to 0.14 inches per year – about twice as fast as the long-term trend.
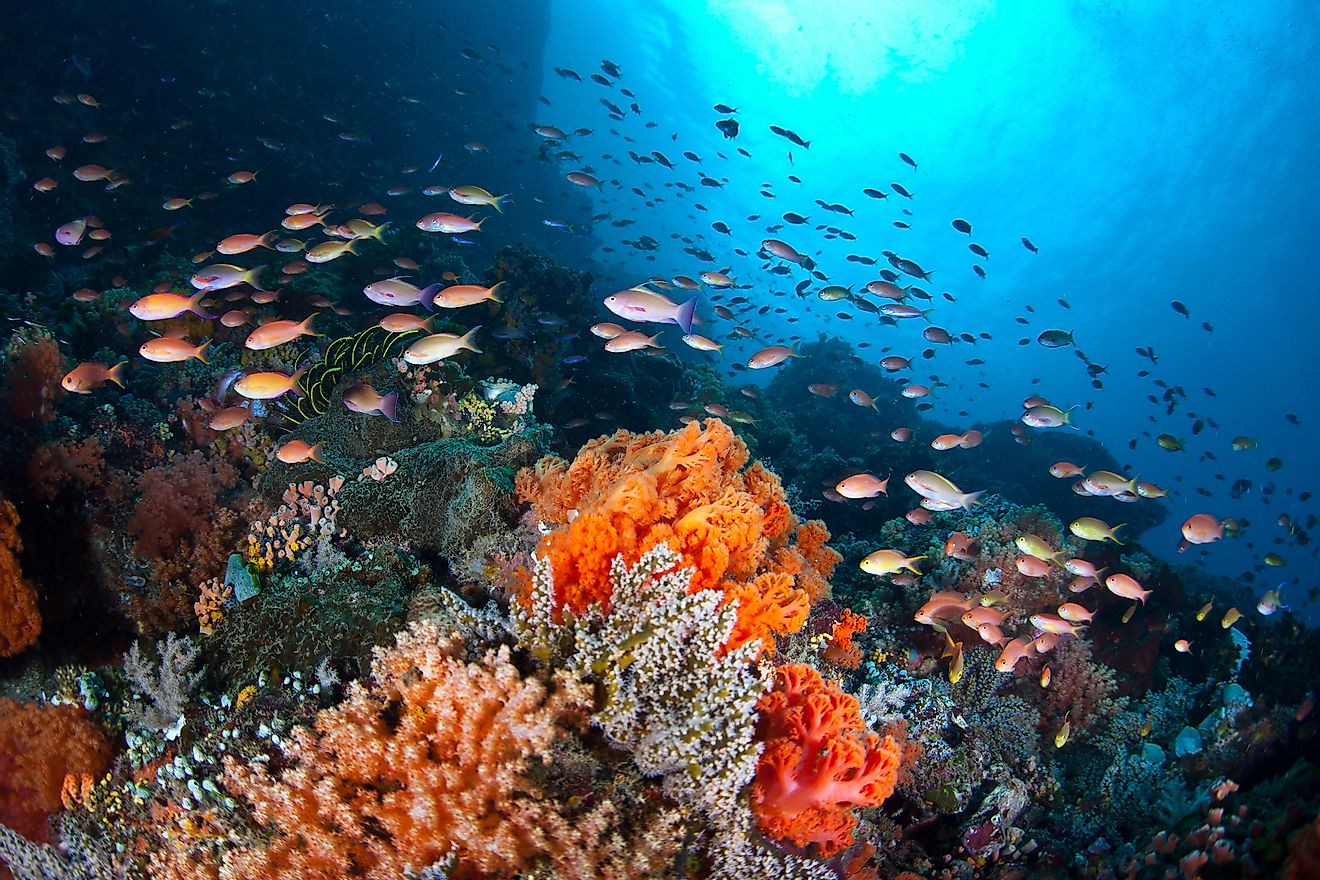
Sea Surface Temperature
Sea surface temperature data is obtained from the analysis of temperature measurements collected from ships and drifting buoys. Oceans all over the world are absorbing heat at an increasing rate, which is leading to a rise in sea surface temperature and ocean circulation patterns. Between 1901 and 2015, sea surface temperature has risen at a rate of 0.13 degrees Fahrenheit per decade. The rising temperatures are likely to affect marine ecosystems, breeding, and migration of marine species. Higher sea surface temperatures can also lead to higher precipitation, tropical cyclones, and drought in some areas.
Glacier Melting
The glacier melting examines the level of snow accumulation relative to melting in glaciers and describes how they have changed over time. Glaciers are large masses of ice and snow that have formed over many years and are present all year round. Glaciers are important indicators since they provide physical evidence of climate change. The indicator examines the change in glacier mass balance (the net loss or gain of ice and snow over a year). It can also be examined through the average change in thickness across the surface of a glacier. The advancing or receding and growing or shrinking of a glacier provides evidence of changes in precipitation and temperature. Scientists have determined that glaciers have been losing their mass since the 1940s. The rate has, however, accelerated in recent times. When glaciers recede or shrink, they add more water to the oceans, which leads to a rise in sea level.
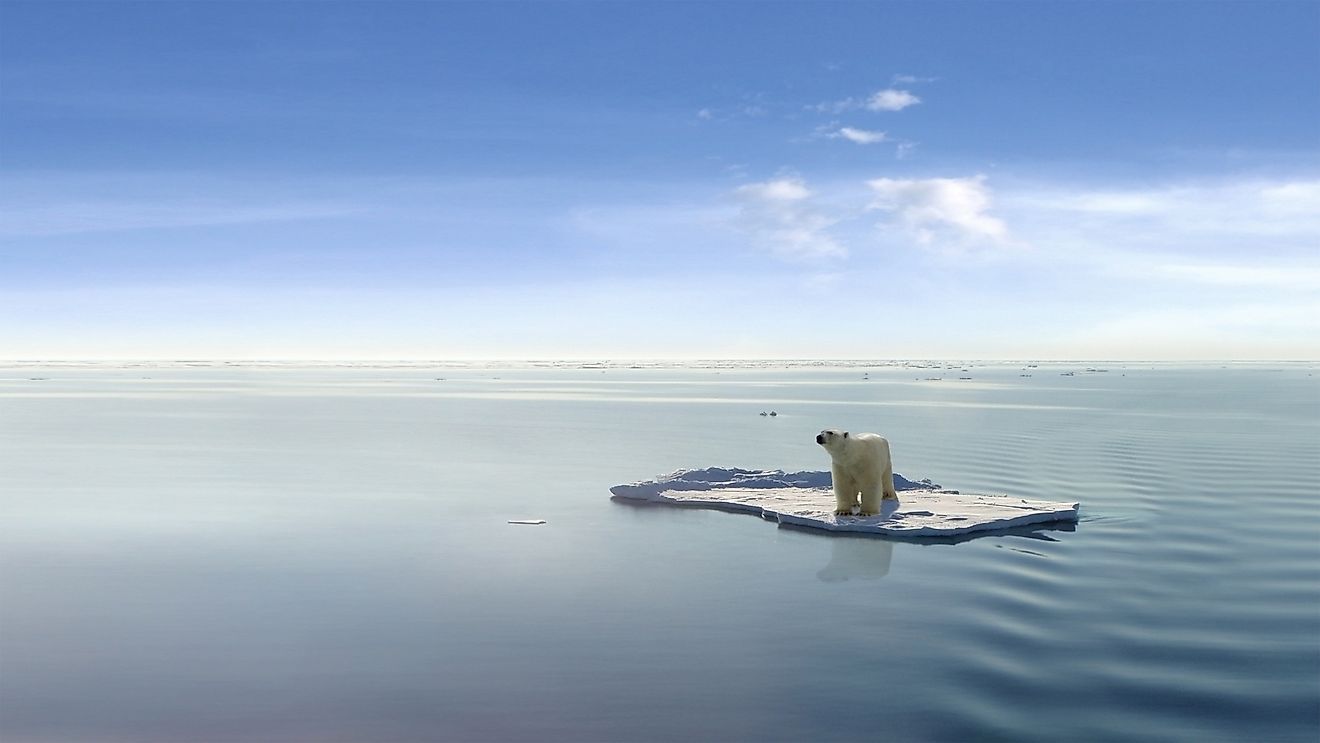
Sea Ice Melting
Sea ice is an integral part of the Arctic and Antarctic oceans. The extent of sea ice helps to show the effects of global climate change since warmer water and air reduce the amount of sea ice in the oceans. The indicator examines the size of the Arctic sea ice and Antarctic sea ice. It also looks at the start and end days of the sea ice melt season and the age distribution of sea ice. The indicator is based on satellite measurements that examine sea ice conditions. The melt season start date is determined when the satellites detect consistent wetness on the surface of the snow and ice. The end date is determined when ice begins to grow in the open surface. Since 1979, the Arctic sea ice melt season has increased by 37 days. The ice now starts melting 11 days earlier and starts freezing 26 days later than it used to, on average. The amount of older Arctic sea ice (five years or older) has declined from over 30% in the 1980s to just 9% in 2015. Consequently, sea ice is thinning and threatening important habitat for animals such as walruses and polar bears.
Heat-related Deaths
Hot summer conditions have become more common. Exposure to extreme heat can potentially lead to deadly conditions, such as heat stroke and heat exhaustion. Hot temperature also contributes to increased deaths due to heart attacks and other types of cardiovascular diseases. The indicator examines the annual number of deaths classified by medical professionals as “heat-related.” It includes death, where excessive natural heat was listed on the death certificate as the leading cause of death. In the United States, heat is classified as the leading weather-related killer. More than 9,000 Americans have died of heat-related illnesses since 1979. Older people aged 65 and above are more likely to die as a result of heat-related cardiovascular diseases. Extreme heat events, also known as heat waves are expected to become more frequent and intense in the future. Consequently, the risk of heat-related deaths is likely to increase.
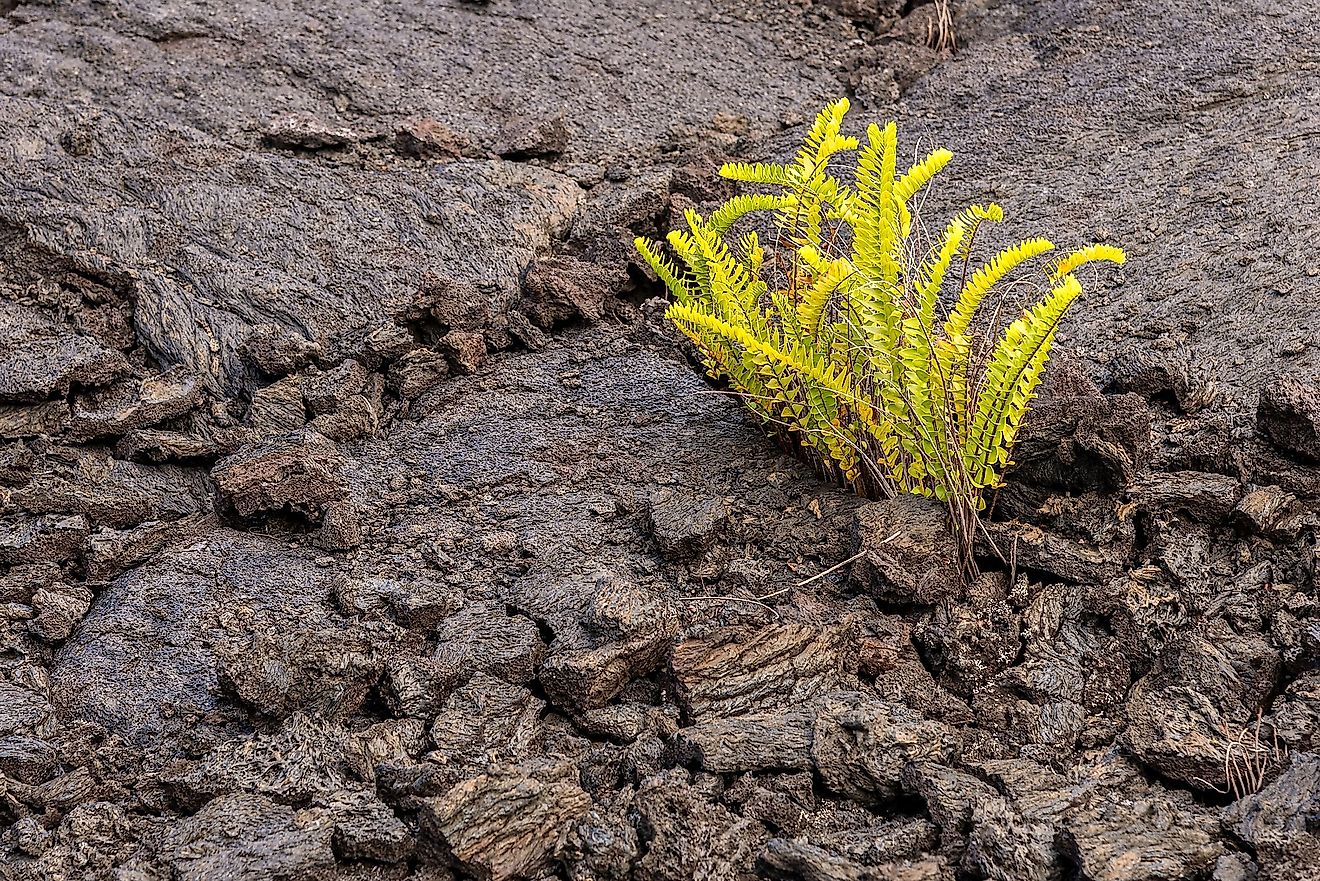
Wildfires

Wildfires occur naturally in various parts of the world. They play a vital role in ensuring the health of grassland, forests, and shrub-land. Climate change is leading to an increase in the frequency, severity, and extent of wildfires due to increasing temperature and drought. Wildfires lead to the loss of life, livelihood, property, and human health. Wildfires also impact Earth’s climate through the release of large amounts of carbon dioxide, which in turn contributes to climate change. The indicator examines the total area of land burned and the severity of damage using satellite images and other methods. In the United States, the area of land burned each year appears to have increased significantly since the 1980s. Of the ten years that had the largest areas burned, nine have occurred since the year 2000, including the peak year in 2015. The data and periods seem to coincide with the warmest years recorded in the US. In Australia, wildfires have also become more frequent and intense. Currently, the country is battling one of the biggest wildfires in the country’s recorded history, which has led to the loss of human lives, death of millions of animals, destruction of property, and the release of a vast amount of carbon dioxide into the atmosphere.
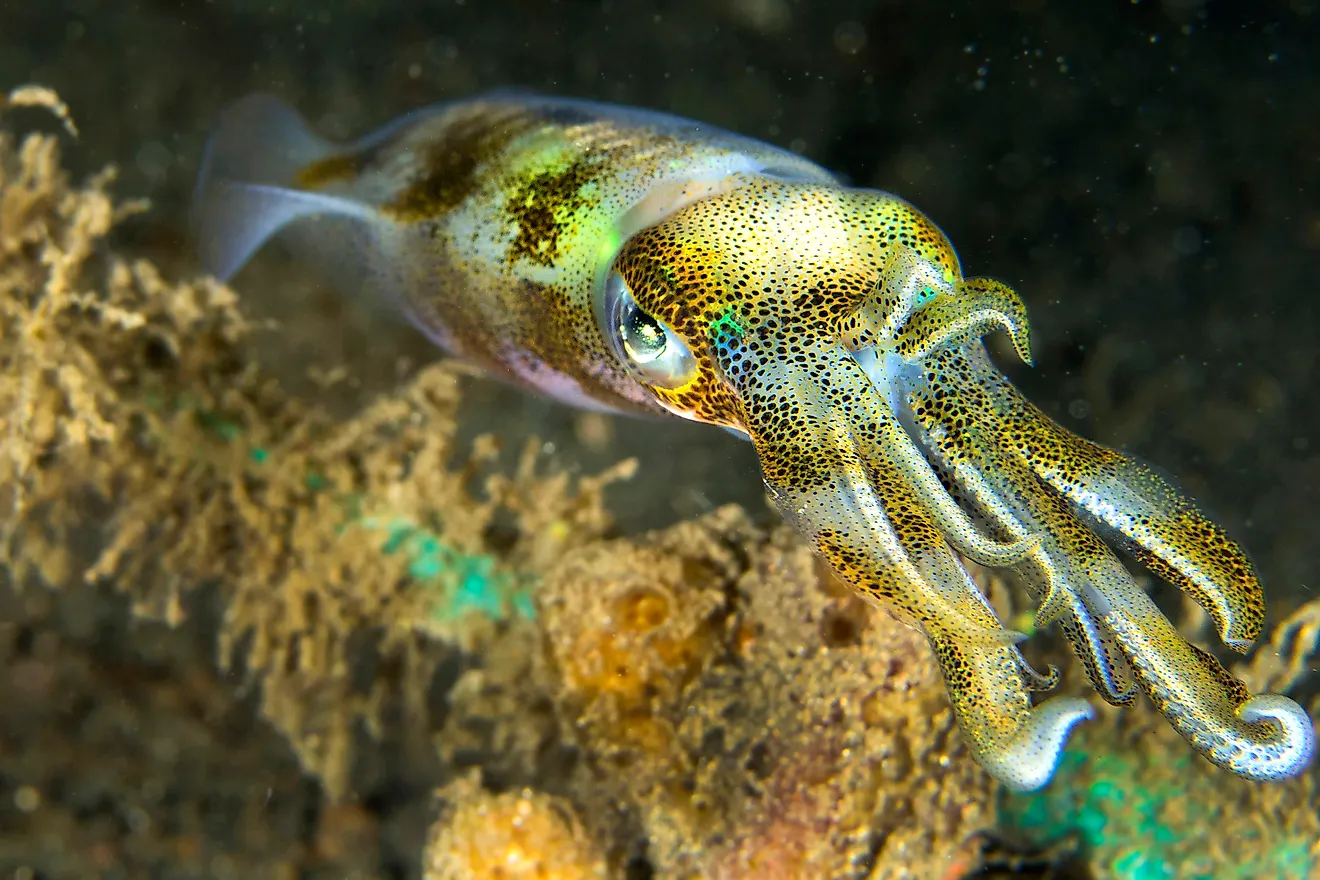
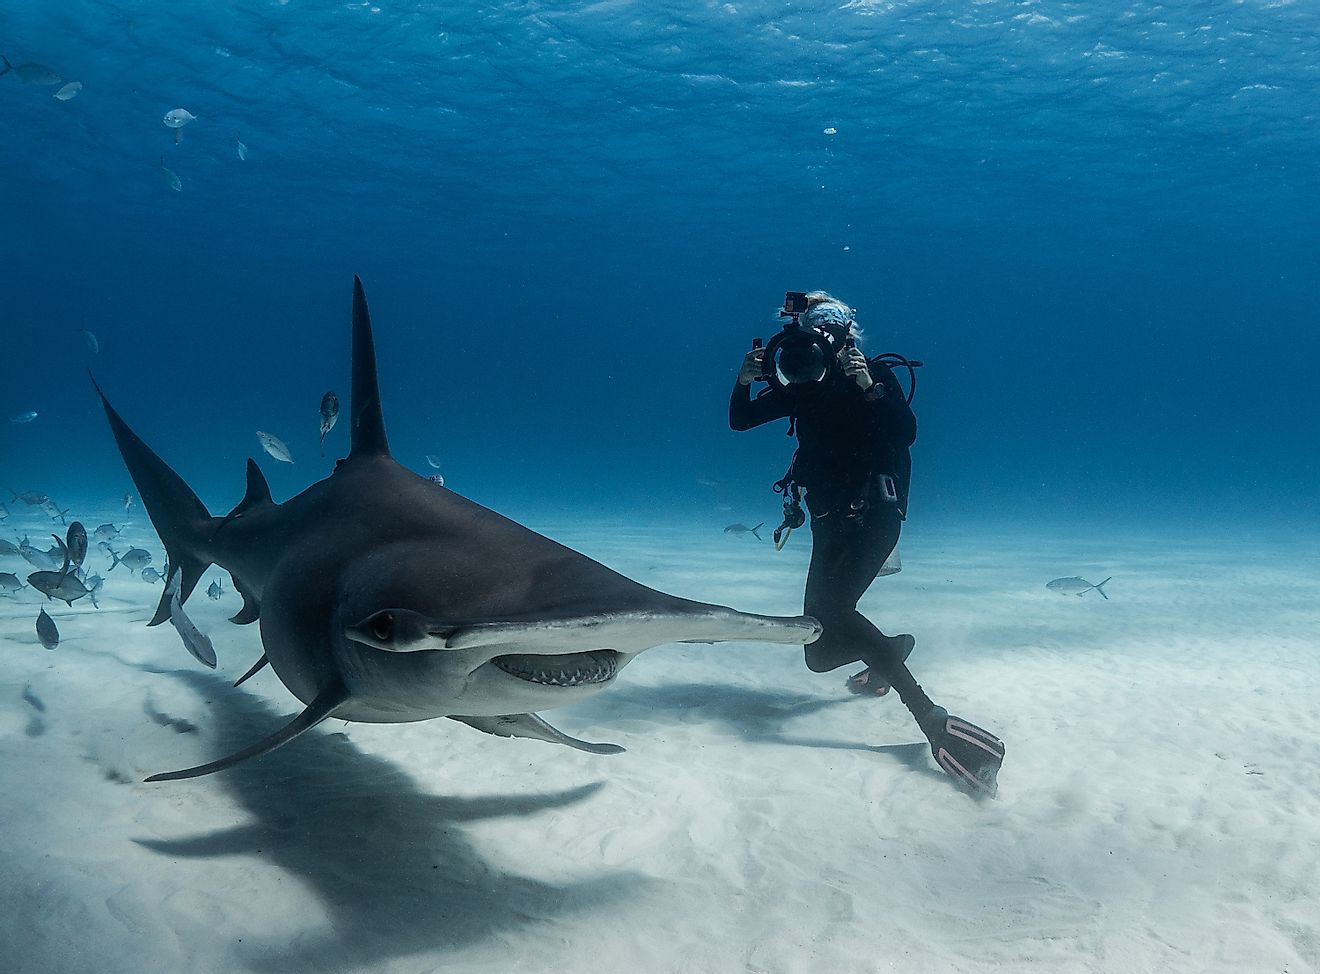
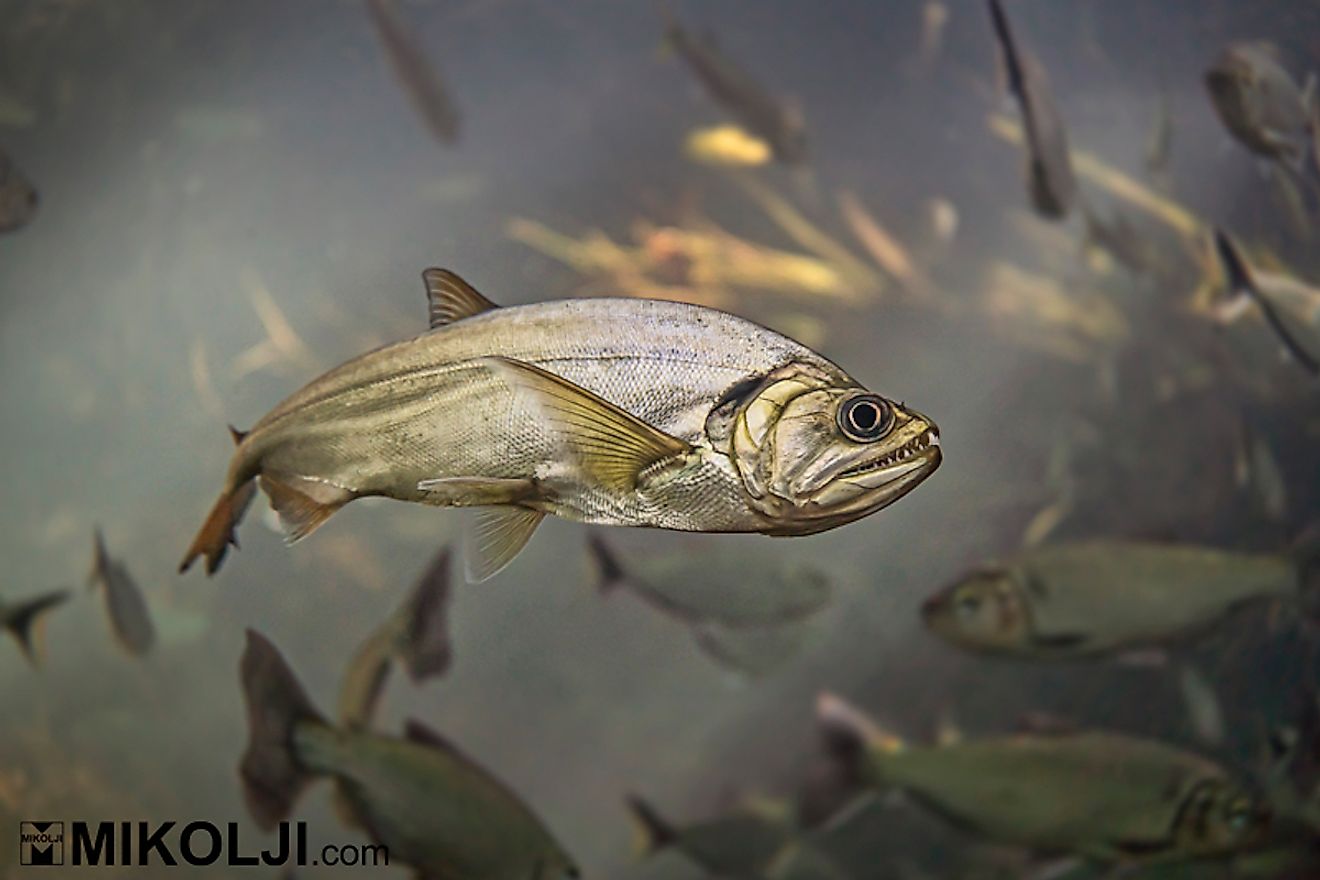
Marine Species Distribution
Various forms of marine life, such as fish, can be affected significantly affected by the changes in the water temperature. As oceans become warmer due to climate change, some fish species may adapt by moving towards cooler areas. Marine life is particularly crucial as an indicator since they are sensitive to climate and have been tracked and studied over a long period of time. The indicator tracks the shift in the central biomass of marine animal species. For example, if a fish population generally shifts to the north, then the central biomass will shift to the north as well. The indicator is based on annual surveys of marine life. Scientists have determined that the average center of the biomass of over 100 marine invertebrate and fish species has shifted north by 10 miles from 1982 to 2015. The species have also moved about 20 feet deeper.
Inadequate Measures In Curbing Climate Change
An emission gap report recently released by the UN revealed that humankind was not doing enough to keep the Earth's temperatures from rising to near catastrophic levels. Commitments made by various nations to mitigate the climate crisis are not enough to stave off record-high temperatures. The report calls on all countries across the world to strengthen the commitments made in the Paris Agreement. Scientists have warned that the measures that are currently adopted will not limit global temperature within a safe level. The G20 nations, which emit 78% of the world’s greenhouse gases, need to do more to limit their emissions.