Green House Gas Emissions By Canadian Province And Territory
What Are Greenhouse Gasses?
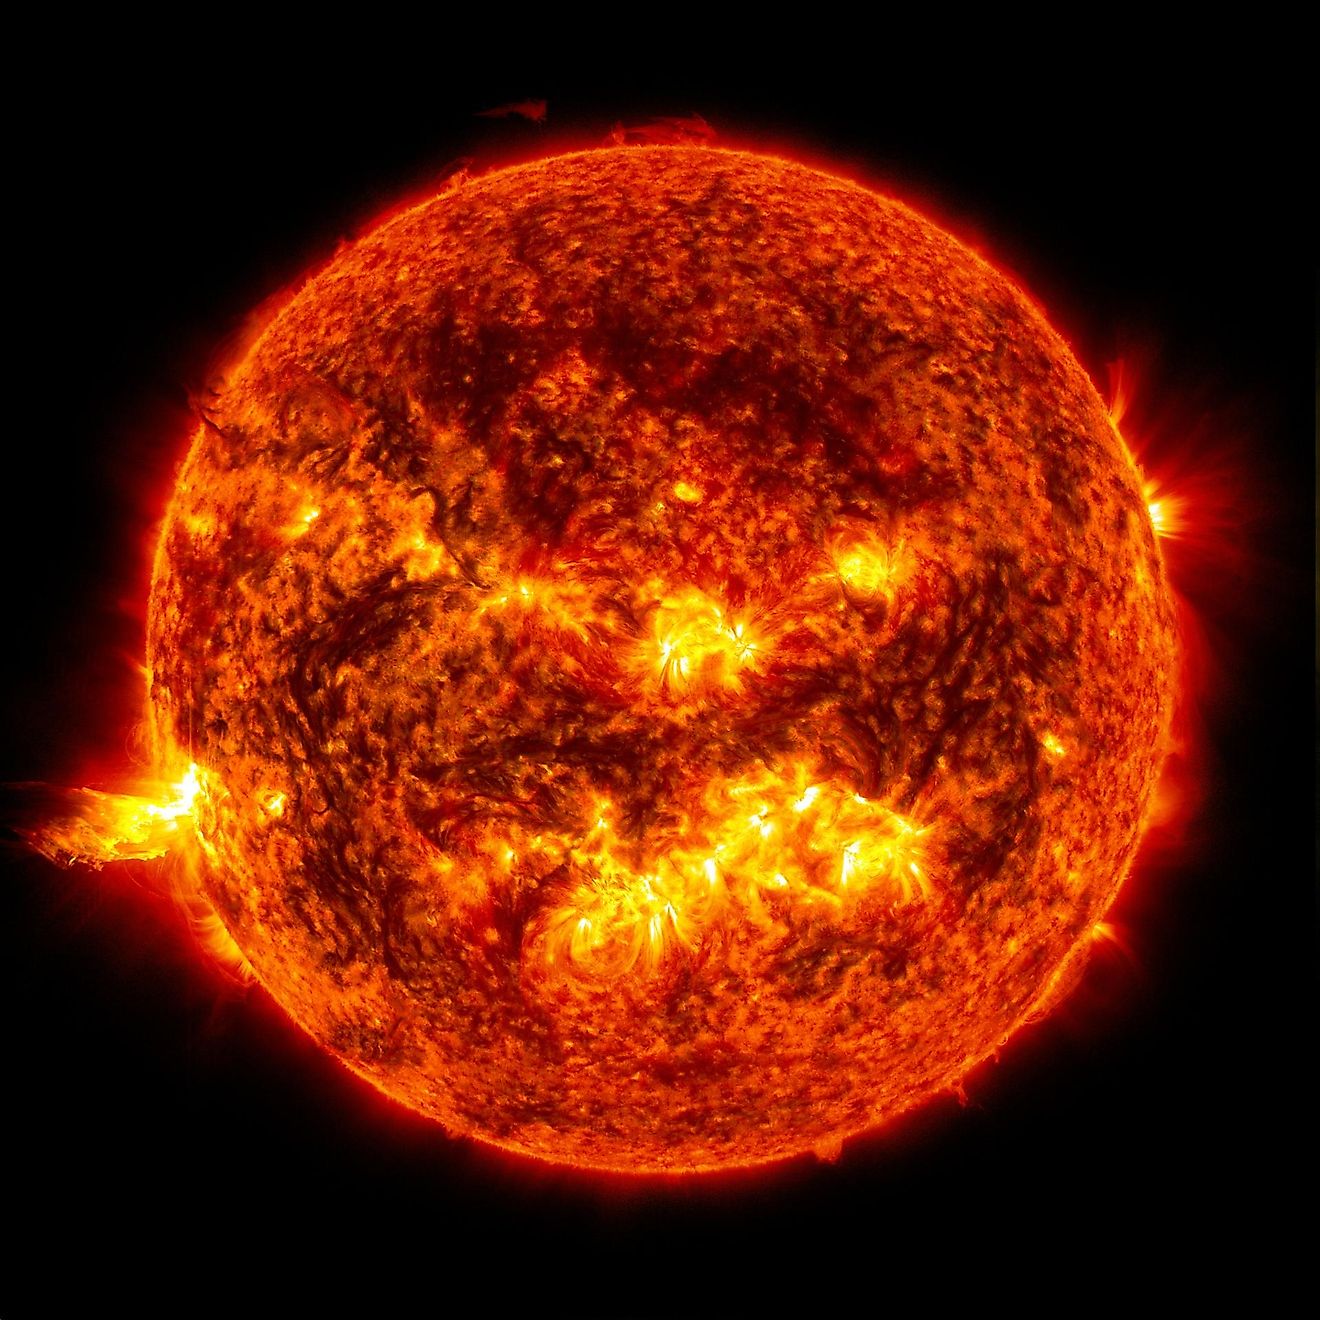
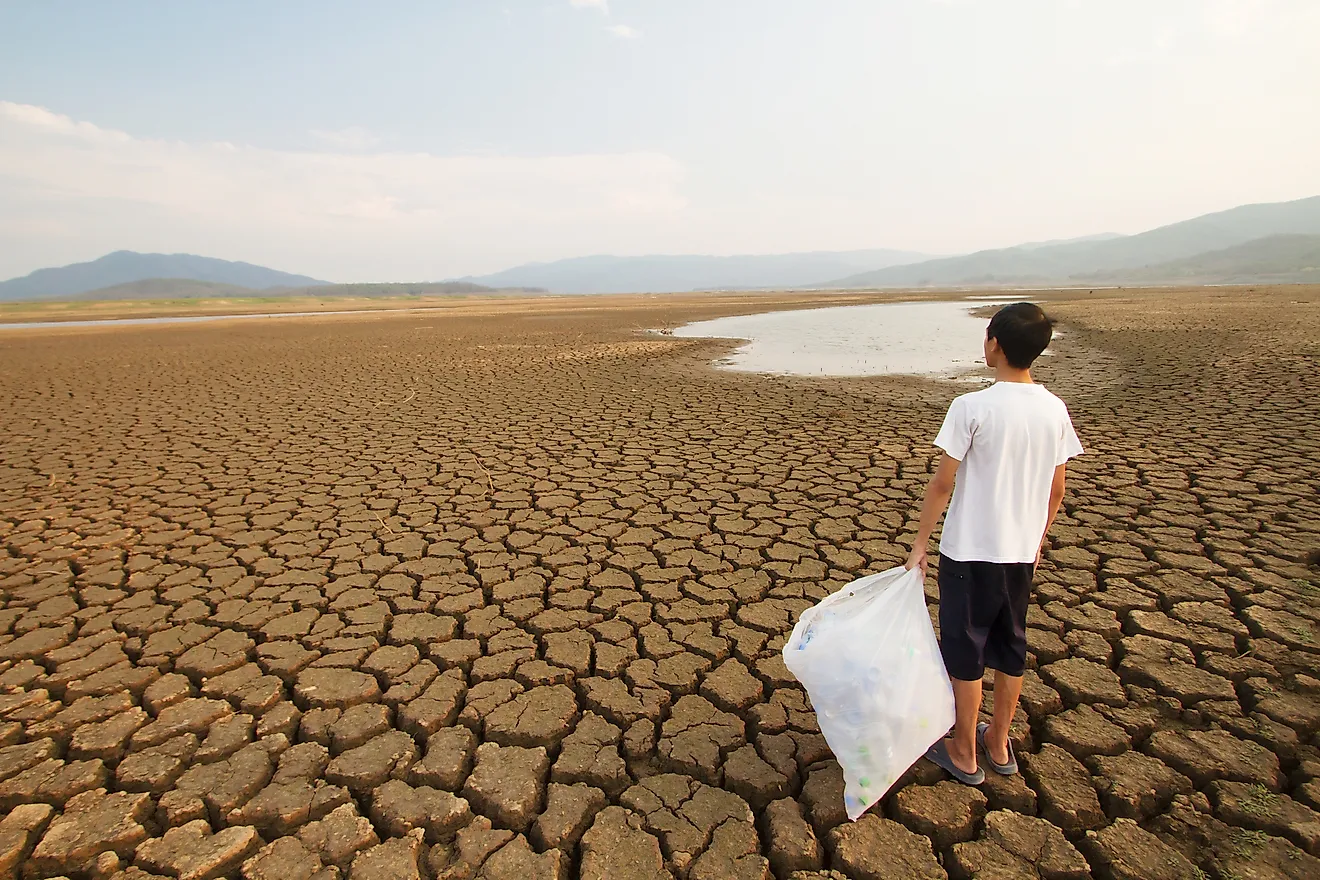
Greenhouse Gases are compounds in the form of gases in the atmosphere that can absorb infrared radiation. The trapped radiations increase the heat in the atmosphere leading to the greenhouse effect and global warming. Some of the GHG's are carbon dioxide, methane, nitrous oxide, and fluorinated gasses among other greenhouse gasses. Each of the greenhouse gas has directed impact on the climate change depending on the amount of gas emitted, how long the gas stays in the atmosphere, and how strongly the gas impacts the global temperatures. Despite the negative effect of greenhouse gasses, countries around the world continue to emit the gasses in large quantities.
Greenhouse Gas Emissions In Canada
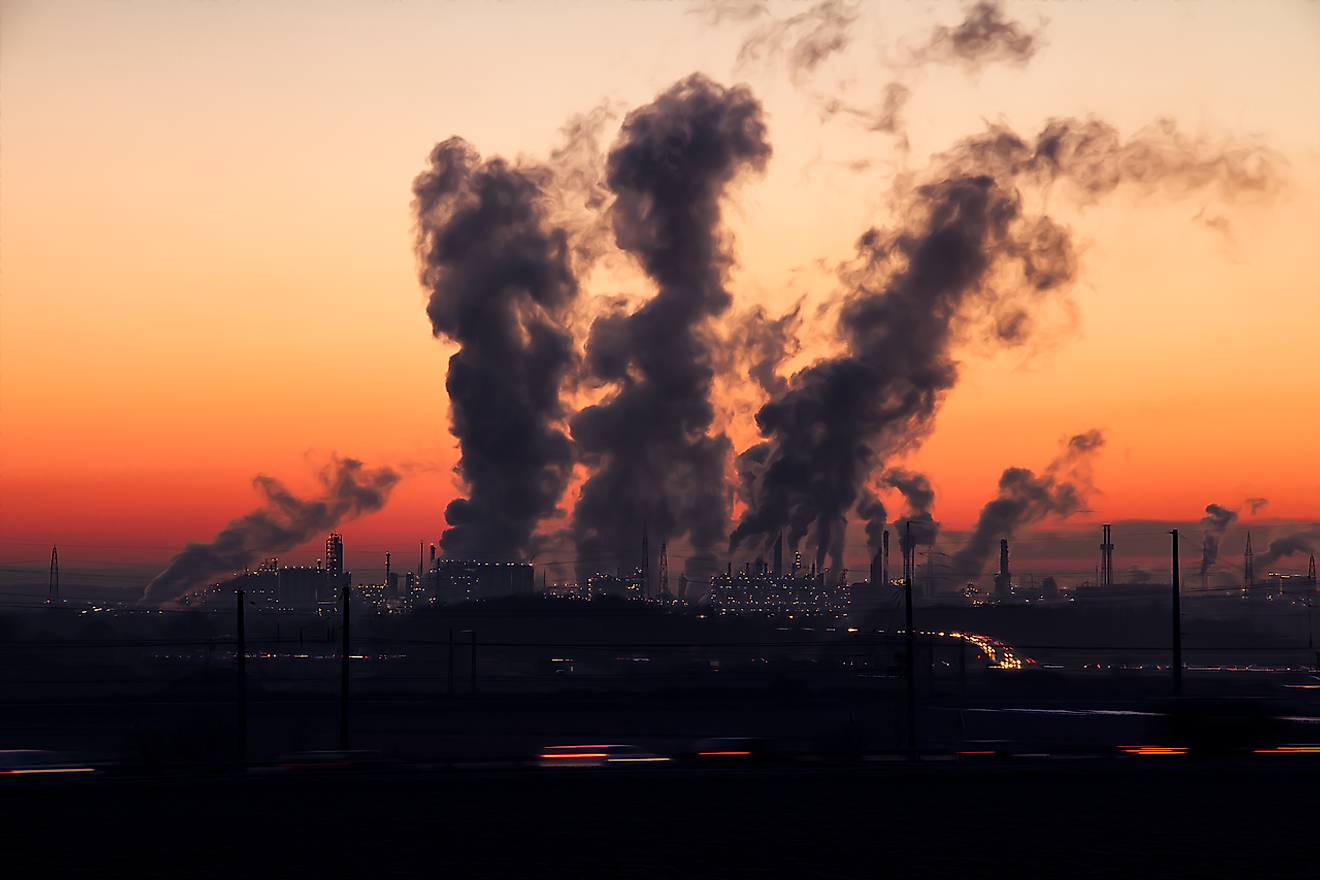
Canada ranks among the top per capita GHG emitters in the world. Canada’s greenhouse gas emissions in 2014 were about 730 megatons of carbon dioxide equivalent signifying a 20% increase compared to the 1990 emission. The GHG emissions were about 20.3 tons per capita which were significantly higher than the average (12.5 tons) emission of the OECD countries. The country witnessed a steady increase in emission over a ten year period between 1990 and 2000 followed by a fluctuation between 2000 and 2008. The growth in greenhouse gas emission between 1990 and 2014 was facilitated by the increased emissions from mining and oil and gas production. Oil accounts for 9.3% of the GHG emissions in the country. Canada has committed to reducing the GHG emission by adopting energy efficiencies and using lower-emitting technologies.
Greenhouse Gas Emission By Canadian Province/Territory
GHG emissions vary by Canadian provinces and territories due to factors such as the population size, the predominant energy source, and the economic base. Provinces whose economies rely on resource extraction have higher emission than those provinces that are service based economies. Provinces which depend on fossil fuel as a source of their energy have higher emissions compared to provinces which rely on the renewable energy sources. GHG emission for Ontario and Quebec were significantly lower in 2014 than in 1990 by about 12 and six megatons of carbon dioxide equivalent respectively. Saskatchewan, Alberta, and British Columbia registered higher emissions during the same period compared to 1990. The three provinces recorded an emission of 30, 99, and ten Mt of carbon dioxide equivalent respectively. The top five GHG emitters in Canada included Alberta, Ontario, Quebec, Saskatchewan, and British Columbia. The five provinces emitted 665 megatons of carbon dioxide equivalent or 91% of the country’s 732 megatons in 2014.
The lowest emitters included Nunavut, Yukon, Northwest Territories, and Prince Edward Island with provinces emitting 0.3, 0.3, 1.5, and 1.8 megatons of carbon dioxide equivalent respectively. In 1990, Ontario had the highest emission because of the presence of the large manufacturing industry in the province. However, Alberta surpassed Ontario due to increased oil and gas industries in the province. Ontario’s emission decreased because of the closure of the coal-fired electricity generation plant. The combined emission by the two provinces accounted for 61% of the national total. British Columbia and Quebec have shown a steady pattern and stable emission between 1990 and 2014 because of their reliance on hydroelectric power. The increase in the transportation sector and activities in the oil industries and mining contributed to the increase in emission by 9% in Saskatchewan between 2005 and 2014
Green House Gas Emissions By Canadian Province And Territory
| Rank | Province or Territory | 2014 greenhouse gas emissions (megatonnes of carbon dioxide equivalent) |
|---|---|---|
| 1 | Alberta (AB) | 273.8 |
| 2 | Ontario (ON) | 170.2 |
| 3 | Quebec (QC) | 82.7 |
| 4 | Saskatchewan (SK) | 75.5 |
| 5 | British Columbia (BC) | 62.9 |
| 6 | Manitoba (MB) | 21.5 |
| 7 | Nova Scotia (NS) | 16.6 |
| 8 | New Brunswick (NB) | 14.9 |
| 9 | Newfoundland and Labrador (NL) | 10.6 |
| 10 | Prince Edward Island (PE) | 1.8 |
| 11 | Northwest Territories (NT) | 1.5 |
| 12 | Yukon (YT) | 0.3 |
| 13 | Nunavut (NU) | 0.3 |