What is an Isohyet?
A contour line is also known as an isarithm, isoline, or isopleth, and it is contour line on a map which represents an imaginary line on the land’s surface. A contour line is always a function of two variables and is depicted as a curve that connects the points where the function has the same value. The function’s gradient is perpendicular to the contour lines at all times. If contour lines are found close to each other, then the magnitude of the gradient increases, implying the variation will be elevated. Contour lines could either be straight, curved, or a mixture of both lines on a map, and they describe an intersection of a hypothetical or real surface with one or more horizontal planes. There are different types of counter lines, and they are often given a specific name which begins with ‘iso’ which is an ancient Greek term meaning equal. The lines are named following the nature of the variable that is being mapped even though the phrase ‘contour line’ is applied in many usages.
Isohyetal Lines
An isohyet is also known as isohyetal line, and it is a line on a map which connects points that have the same amounts of precipitation in a given period or for a particular storm. The method used in estimating average rainfall across a particular area is known as an isohyetal method. The method is used when drawing lines of equal precipitation on a map. Additionally, an isohyetal method uses topographic data together with other data to come up with authentic estimates. The method allows for the plotting of rainfall values on a proper basemap at their respective stations. Isohyets are then drawn to create an isohyetal map. Isohyetal lines are mainly based on interpolation between rain gauge stations. When isohyets are being created, it is hypothesized that precipitation between two different stations differs linearly unless there is a rapid or brief change in topography that indicates the opposite.
History
The meteorologists of the 17th century were presented with new instruments as a result of the scientific renaissance at the time. Instruments like thermometers and barometers quickly built huge weather data, and there were no known methods of drawing salient conclusions from the huge array of data. Initially, the data were tabulated to allow some conclusions to be drawn. However, there some limitations and over time there were attempts to represent data pictorially by transforming the information in the numbers to some form of a diagram to display some pattern. The concept of creating lines that connect points of equal value was discovered. An isobath, which is the line that connects points of equal or constant depth, was the oldest form of a contour line found on a map dated 1584. Later on, Edmund Halley, an English meteorologist used contour lines on a chart to show magnetic variations in 1701. In 1727, Dutch engineer Nicholas Cruquius drew the Merwede’s river bed with isobaths at intervals of 1 fathom. By the year 1843, the Ordnance Survey had already begun recording contour lines in Ireland and Great Britain; contour lines were already being used in European countries. However, isobaths were never regularly used on nautical charts until the year 1834 when Russia used them and those of Britain in the year 1838. Finally, when contour lines became more popular, the idea spread and meteorologist started developing them for other applications. The latest contour lines to be created are noise pollution and air quality contour maps. The two new contour lines first appeared in the US around 1970 mainly due to the national legislature’s need for the spatial delineation of these parameters.
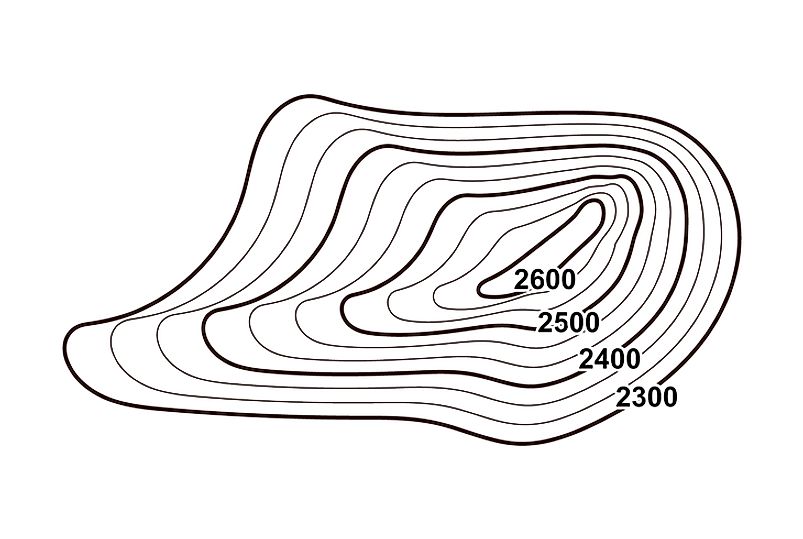
Drawing and Labeling of Contour Lines
The most common isolines are usually drawn in plain view or simply as an observer who is in space would view the surface of the Earth; they are drawn in map form. Nonetheless, some parameters are shown in profile view thus displaying a vertical profile such as sound levels or air pollutant concentration. Labeling of contour lines is an important component of elevation maps; this is because a well-labeled contour map will help the reader to translate the shape of the terrain a little faster.