What Are the Different Types of Maps?
- Road maps, politic maps, and cadaster maps are a few different types of maps.
- Shallow water is usually depicted as a deeper blue color whereas deeper water is depicted as a lighter blue on maps.
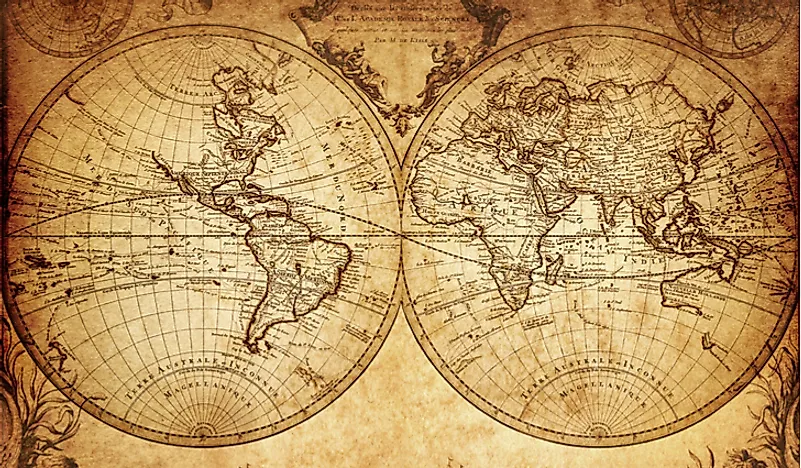
- Maps have been used for centuries.
A map is a symbolic representation of an actual element or an area on a flat surface. Maps are useful because they illustrate specific and detailed features of a given area, region, or an object. They represent features such as boundaries, topography, physical features, climate, and even economic activities. There are different kinds of maps including dimensional, static, dynamic, and interactive maps. Maps have been in use since ancient times when they may have been produced and used as necessary tools for identification and navigation. Maps became more and more accurate and factual in the 17th to 19th century with various countries adopting national mapping programs. The widespread use of aerial photography during World War I contributed significantly to the map-making process. Discussed below are some of the different types of maps.
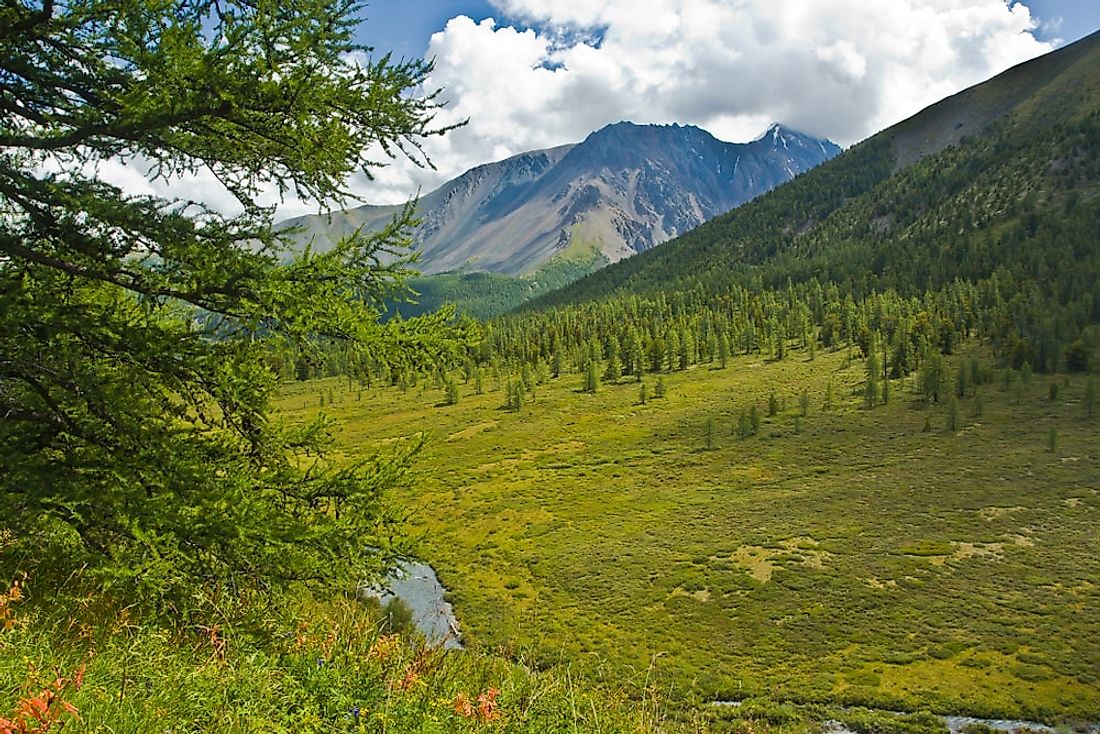
Topographic Map

A topographic map is a type of map that shows large-scale detail and quantitative information of relief by the use of contour lines and various other methods. The map shows both human-made and natural topographical features. A topographical map is based on a topographical survey that has been performed on a large scale and shows varieties of elevations and landforms. Topographic maps have various uses including geographical planning, civil engineering, large-scale architecture, and recreation such as hiking. Features on the map are usually represented by conventional signs and symbols. For instance, different colors can be used to indicate the different classifications of roads. The signs are usually explained just below the map or on the margins. Apart from contour lines, topographic maps also show forest covers, water bodies, and buildings.
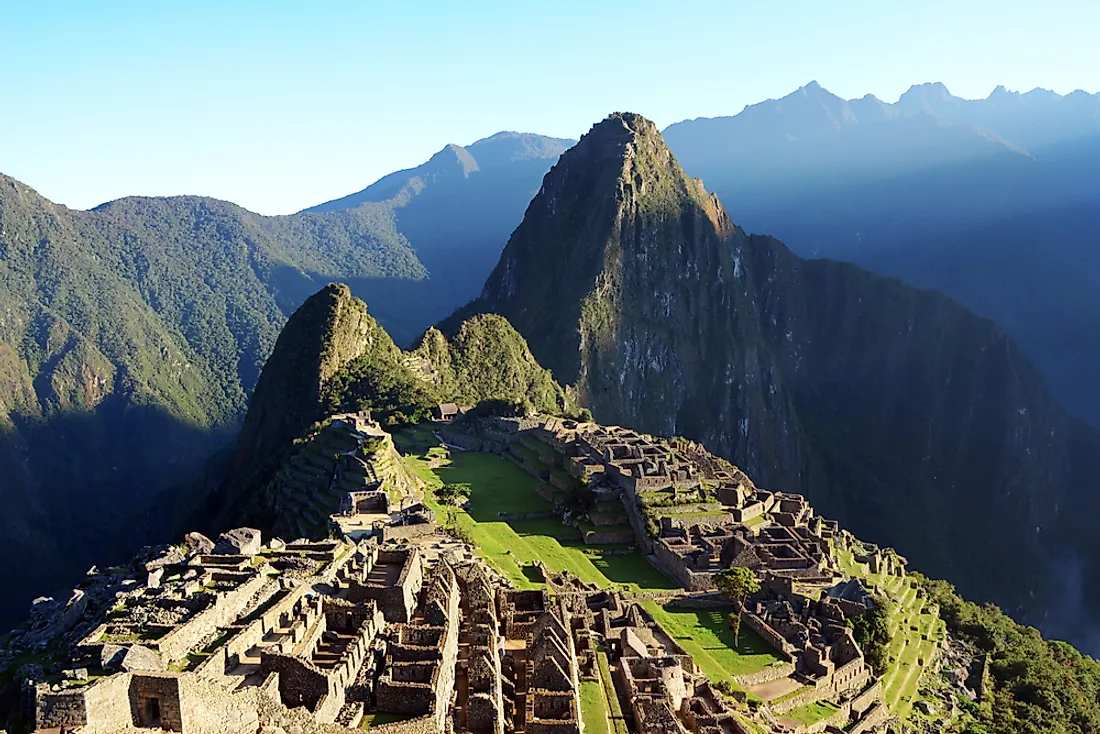
Geologic Map

A geological map is a map that is used to show geological features such as geologic strata and rock units. The location of these features underneath the earth's surface is shown by symbols or colors. Other features such as fault lines, foliations, and folds are shown with strike and dip symbols which gives them a three-dimensional orientation. There are two main types of orientation measurements: orientation of planes measured as “dip” and “strike” and orientation of lines measured as “trend” and “plunge.” Trend and plunge are symbolized by single arrows and are used for linear features while strike and dip are symbolized by a long strike line perpendicular to the direction of the slope. In the US, geologic maps are superimposed over topographic maps with additional color masks with letters to represent a geologic unit. In the UK, the term “geological map” is used instead of a “geologic map.”
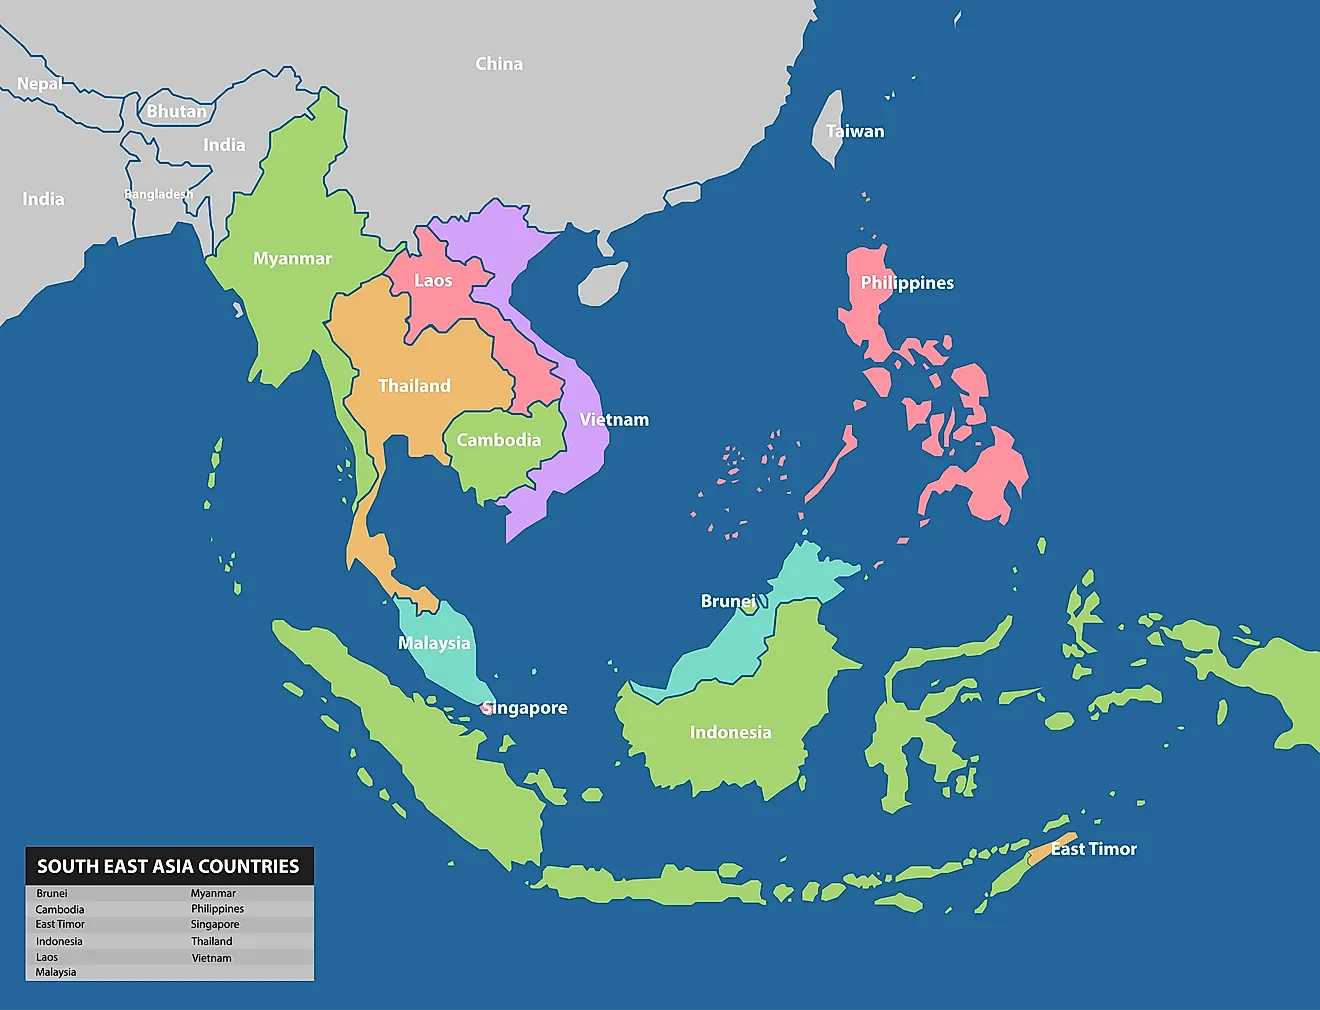
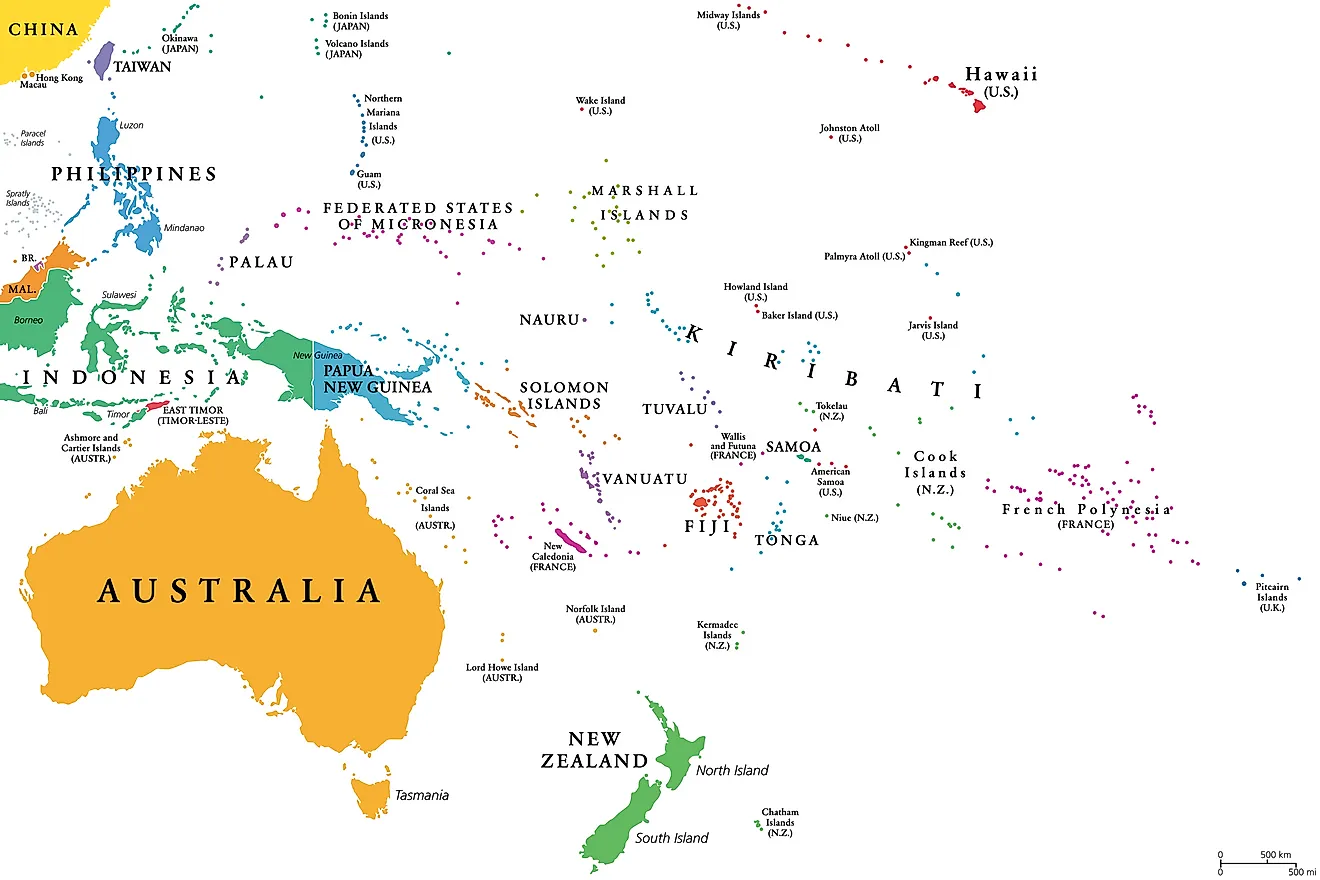
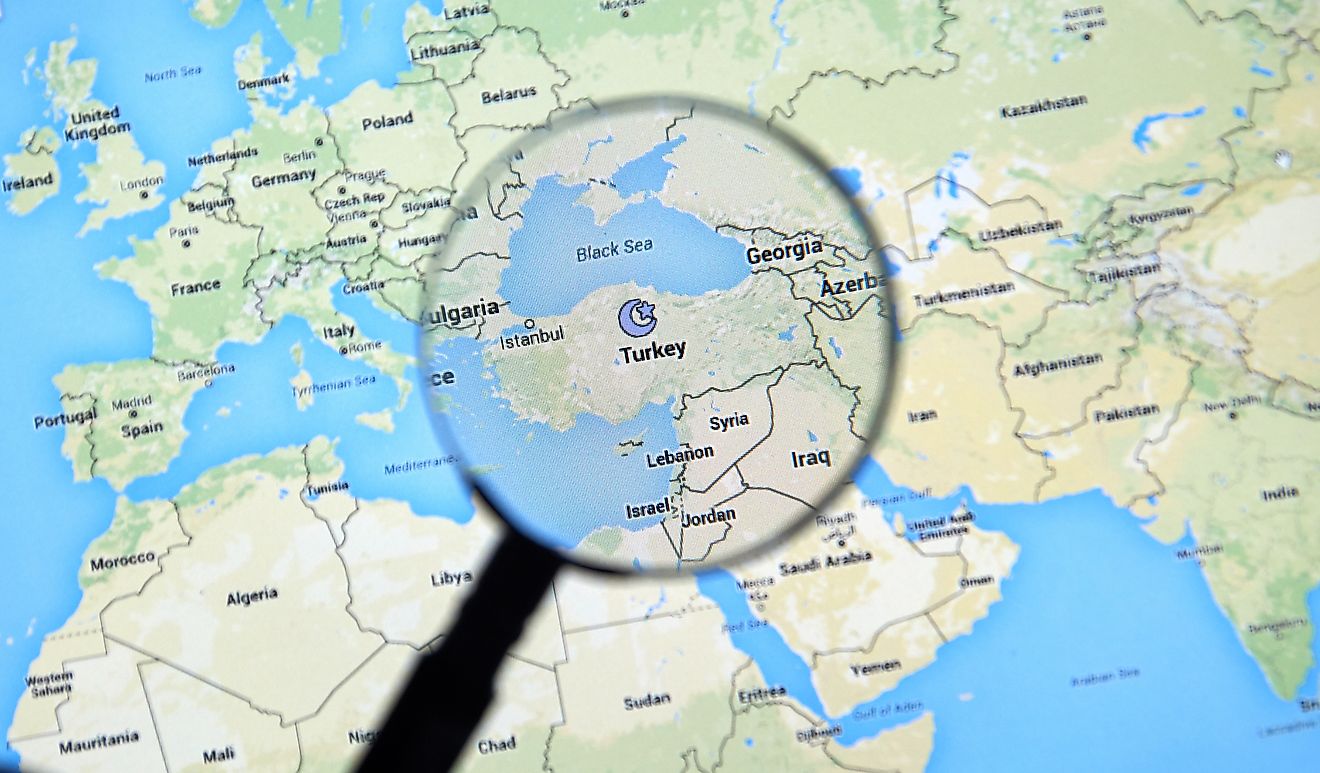
Political Map

World maps are generally political or physical. A political map is a map that shows the political features of an area, country, or region. It shows a region or country’s different territorial borders or boundaries, the location of major areas or cities, and significant landmasses such as bodies of water. There are different sizes of political maps. Some of these maps cover an entire continent, an entire region, or a state or country. One of the main features of a political map is the geographical boundaries. The boundaries between countries, cities, or states, are indicated by lines. Political maps help in understanding the geography of the world and are usually the first maps that students are introduced to in school. This type of map is also known as “reference map” and is either printed on a physical medium or paper. It can also be produced in digital form for online use.
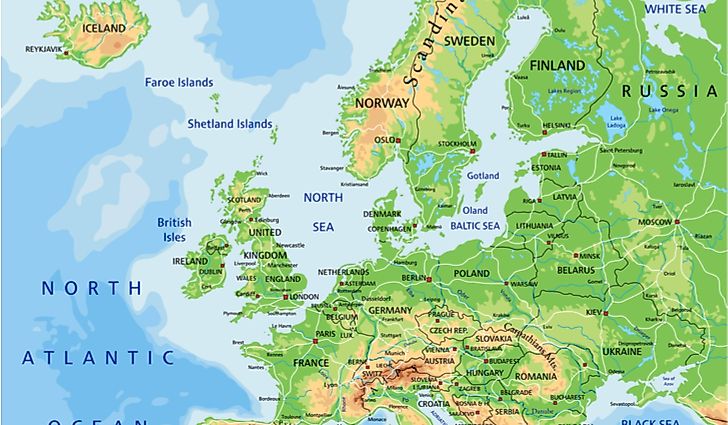
Physical Map

As the name suggests, physical maps are maps that have been designed to show the physical or natural landscape features of the Earth. The maps are best known to show several geographical features such as soil type, mountains, and land use including infrastructural developments such as roads and buildings. Physical maps are some of the most colorful maps with a different color used to indicate different physical features. Most maps use green to brown to gray color scheme to show elevation. A dark green color is used to indicate near-sea level elevations and brown for higher elevations. Water bodies such as lakes, rivers, and oceans are often indicated by a blue color (light blue for shallow areas and dark blue for deeper waters). Ice and glacier are shown in white color. Cultural information is not a focus of physical maps but may be included on the map for geographic reference.
Road Map

Road maps, also known as route maps, indicate roads and other transport links. They are navigational maps that also include political boundaries, making them part of political maps. Apart from road and boundaries, road maps also show certain points of interest such as tourism sites, prominent buildings, recreational facilities like parks and restaurants, train stations, and airports. The maps are of different sizes, shapes, and scales. Small maps are used to show the overview of a region’s major roads or routes while large maps give greater details and cover a large area. Highway maps give an overview of major routes within a region. Street maps mainly cover areas within a city or metropolitan area. A collection of road maps bound together in a book is referred to as road atlas. Road maps often use thin lines to indicate minor roads and thicker or bolder colors to indicate major roads.
Cadaster Map

A cadaster map is a map showing the real estate of a country. It includes the location, area, ownership, value, and tenure of an individual parcel of land. According to the International Federation of Surveyors, a cadaster is an up-to-date land information system that contains records of interest of lands such as restrictions, rights, and responsibilities. It includes the geometric description of the land and used alongside other records that describe the nature of the interest, controls of such interest, and the value of the parcel of land. Some maps also show additional information such as parcel’s identification number, survey district name, certificate of title number, adjacent street names, and position of existing structures.
Dot Distribution Map

As the name suggests, a dot distribution map is a type of map that uses dot symbols to indicate the presence of features and depends on visual scatters to show spatial patterns. There are two main types of dot distribution maps; one-to-one and one-to-many. In a one-to-one dot map, each of the dots shows one single recording of a feature. In a one-to-many dot map, a dot on the map shows more than one feature being mapped but the dot distribution does not show the actual location since they are arbitrarily placed on the map. Dot distribution maps come in handy when mapping features that change smoothly over space. However, the random placement of the dots may make the map ineffective in communicating its messages.
Thematic Map

A thematic map is a map designed to highlight a theme connected with a specific geographic area. Unlike a general reference map that shows several phenomena (geographical, political, and geological), the thematic map focuses on a specific subject area and uses base data only as a point of reference for the feature being mapped. Thematic maps also put emphasis on a spatial variation on a number of geographical distributions such as climate, population density, and health. The map serves three main purposes: to provide information about a piece of specific information, to provide general information about the spatial pattern, and to compare patterns on different maps.