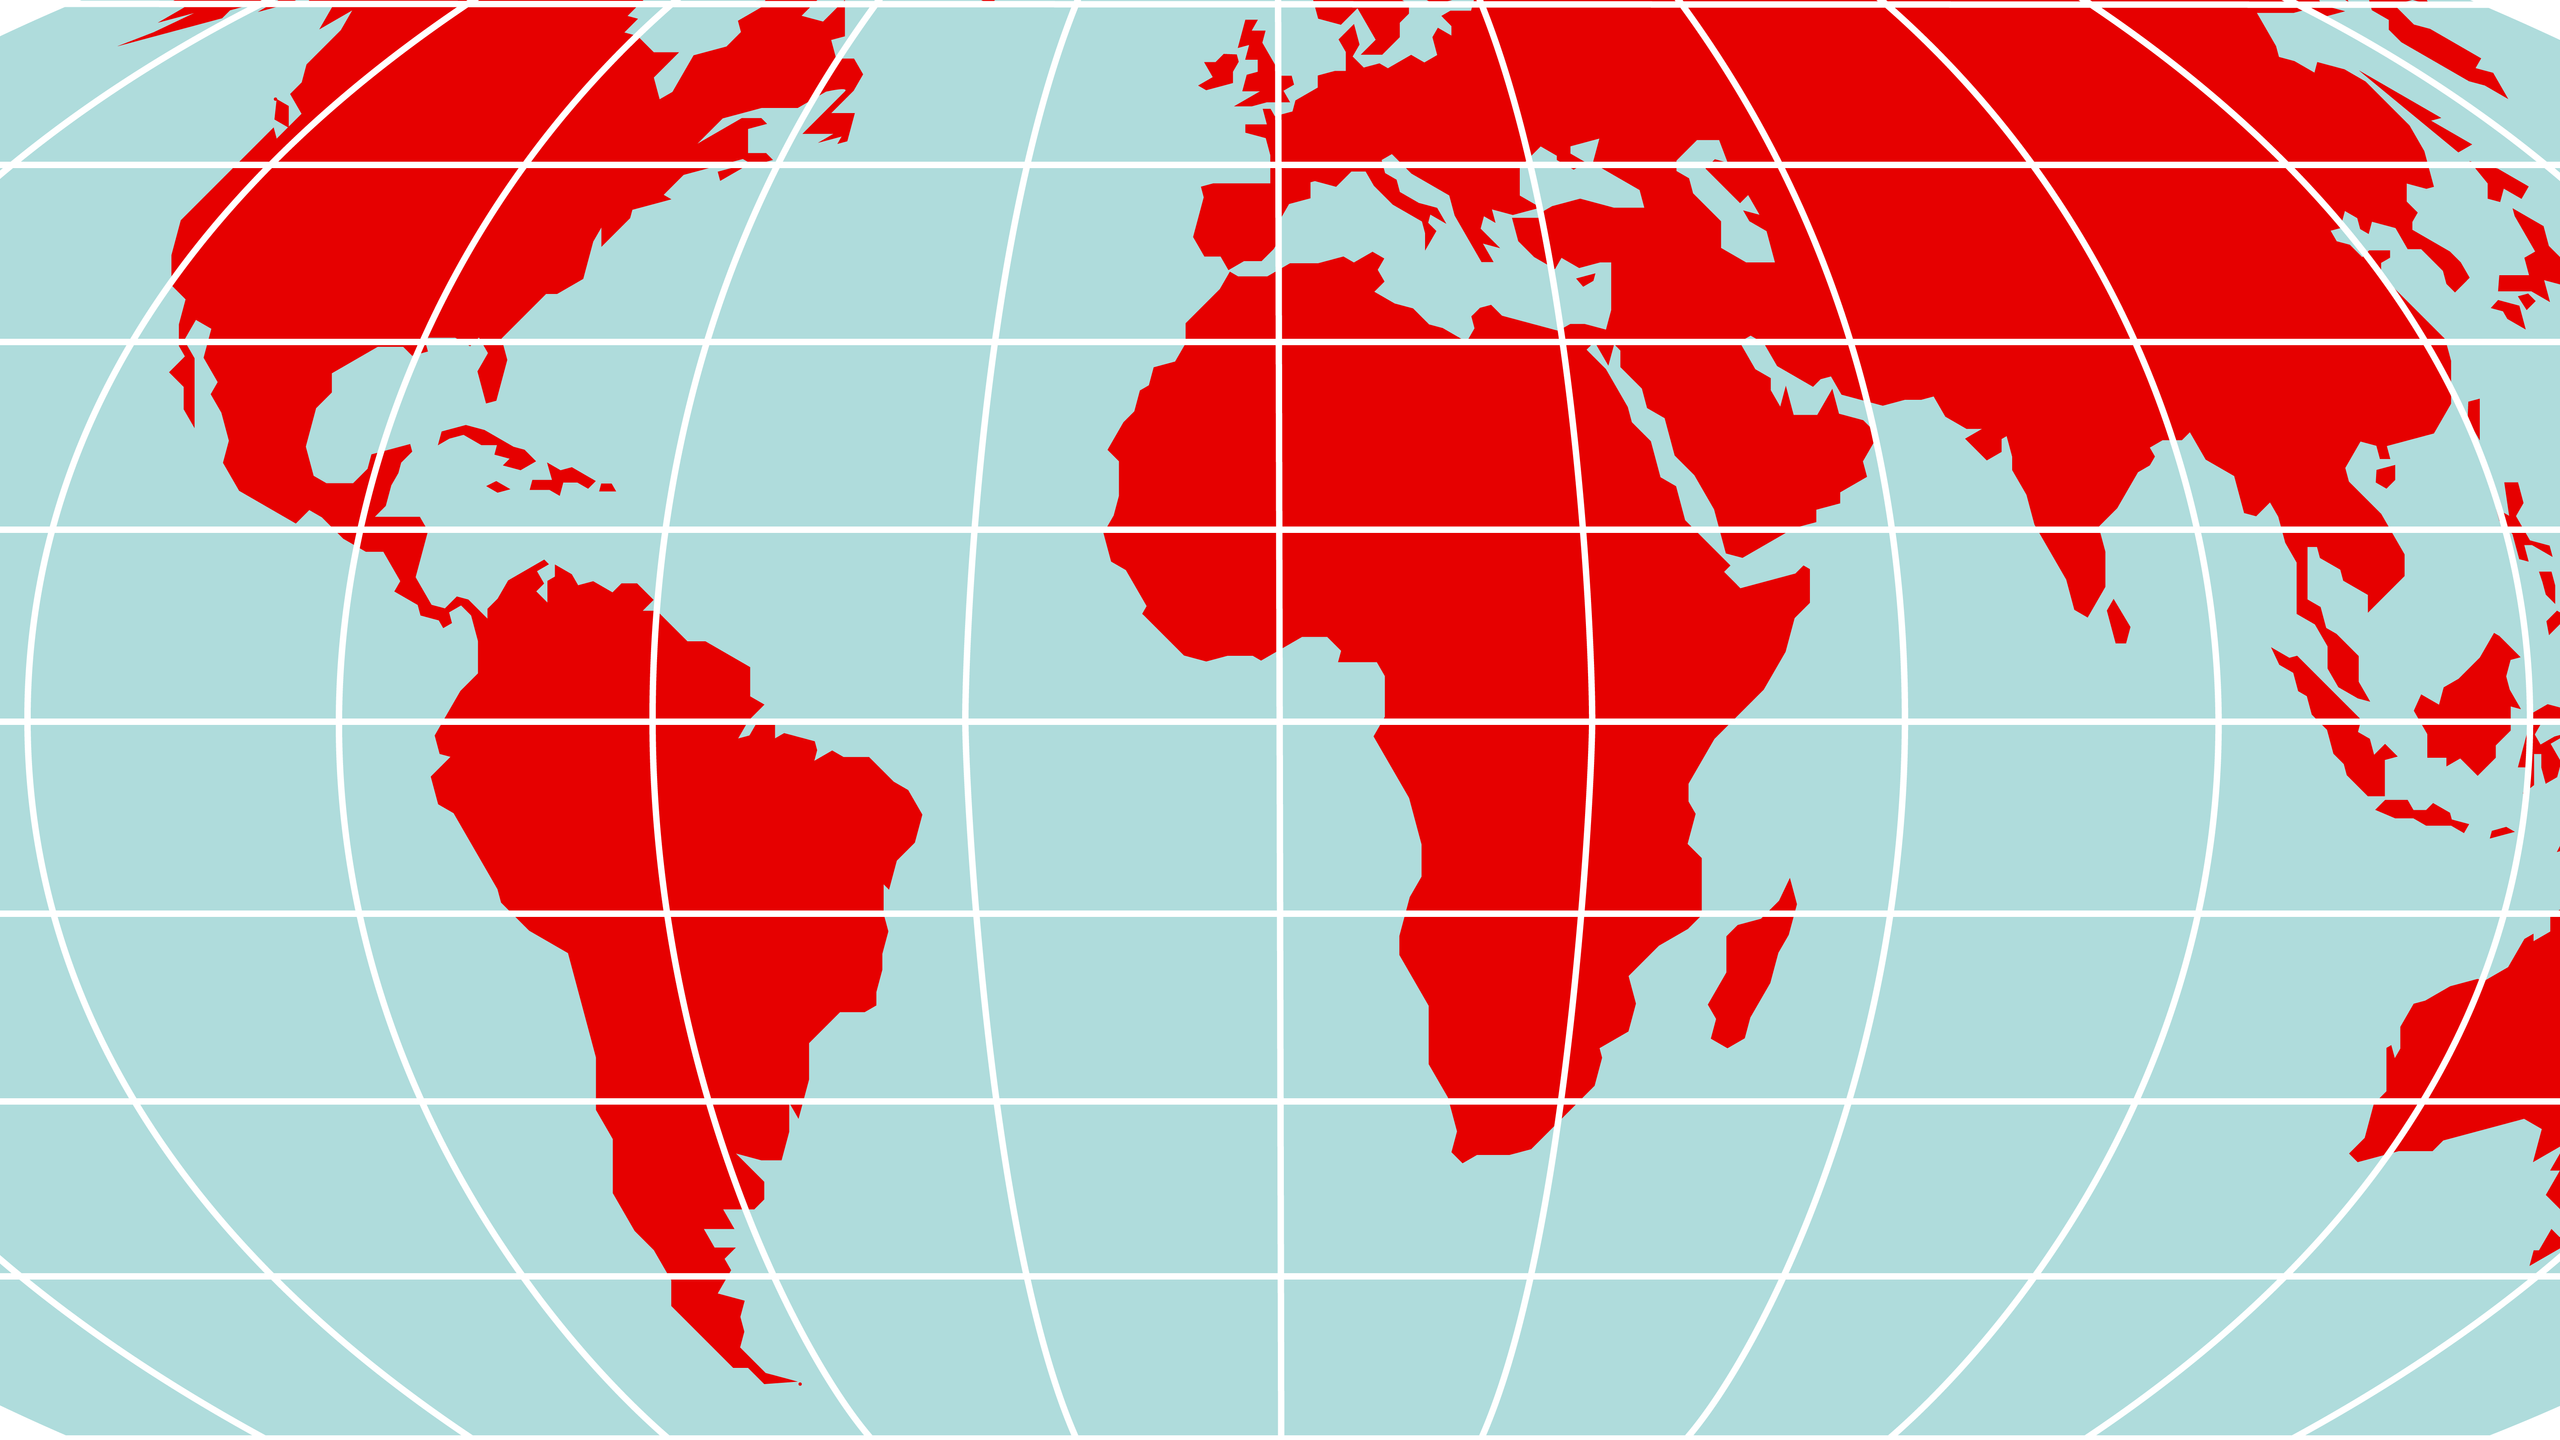
World Map - Mollweide Projection
A map projection is a technique of presenting the entire globe’s surface on a flat plane or area. Different types of map projections exist, including pseudo-cylindrical, cylindrical, conic, planar, and hybrid projections. In pseudo-cylindrical projections, the central meridian is represented as a straight line, while other meridians are longer and bow outwards. One example of a pseudo-cylindrical projection is the Mollweide projection, developed and published by Karl Brandan Mollweide in 1805.
Description
Mollweide, also known as homalographic, Babinet, or elliptical projection, is an equal-area projection that displays the globe as an eclipse with an axes proportion of 2:1. This projection is used appropriately where accurate areas are required rather than accurate shapes and angles. The projection was first published in 1805 and reinvented by Jacque Babinet in 1857, who renamed it homalographic projection.

Properties
In Mollweide projection, the central meridian and the equator are projected as a straight perpendicular line. The equator is twice the length of the projected central meridian. The 90 degrees west and 90 degrees east form a circle, while the rest of the meridian assume the same spacing at the equator. All parallels are distributed unequally as straight lines perpendicular to the central meridian, with their spacing increasing towards the equator.
Distortions
Mollweide, like most pseudo-cylindrical projections, generally presents distorted shapes, angles, directions, and distances. However, points around the 40 degrees north and south at the center meridian do not have distortion. The bulging outward meridians cause considerable distortions near the projection’s edges. Shape distortion can be reduced using a sinusoidal interrupted Mollweide, which replaces the central meridian with half-meridians.
Usage
Mollweide projection is commonly used in small-scale mapping and thematic maps to illustrate accurate area characteristics. Thus, it is used mainly on maps that require accurate areas as opposed to those requiring accurate shapes and angles. It can also be used to show distributions of global data.