Countries By Population
As of 2021, the world’s population is estimated to be 7.63 billion people. Asia is the most populous continent, accounting for about two-thirds of the total population. World’s five most populous countries are China, India, the US, Indonesia, and Pakistan, with a combined population of 3.6 billion. The UN predicts the global population will surpass the 10 billion mark by 2100.
Population growth rate varies by country and region. However, most countries and regions have positive population growth. But, the growth rate has declined significantly in some countries like China, due to government measures to reduce the ballooning population. The population growth rate is particularly high in Sub-Saharan Africa, with countries like Tanzania, Ethiopia, and the DRC expected to join Nigeria on the list of the top ten most populous countries by 2100.
Contents:
- Top 10
- Bottom 5
- Most Densely And Most Sparsely Populated Countries
- Population Distribution Across The World
- Most Populous Countries By 2100
- All Countries By Population

Top 10 Countries By Population
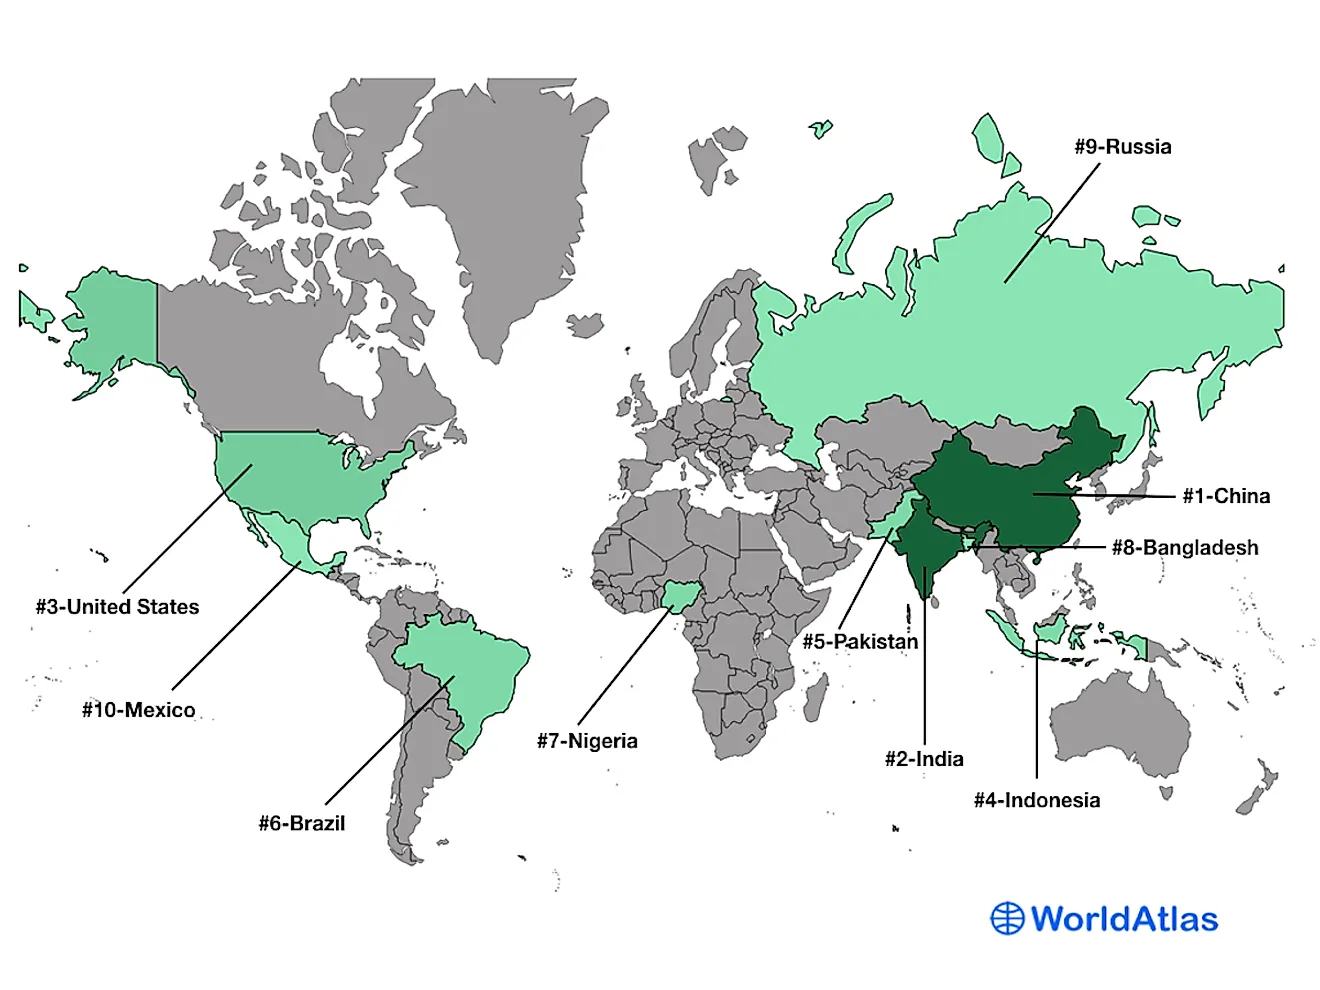
According to the recent UN estimates, about 47% of the global population, or 3.6 billion people live in five countries. Five of the ten most populous countries are in Asia, three in the Americas, and one each in Europe and Africa.
With 1.4 billion people, China is the world’s most populous country. It accounts for about 18.4% of the world’s population. The proportion of China’s population to the global population has been shrinking over the years. In 2000, it accounted for 21% of the global population. China’s population is approximately four times the US population, despite the US having a slightly larger total surface area.
India and China are the only two countries with a population of over one billion people. India’s population is 1.37 billion, making it the second-most populous country. It is the 19th most-densely populated country, with about 409 people per square kilometer. With a 1.2% population growth rate, India could be the first country to host more than 1.5 billion people.
The United States is the world’s third-most populous country, with 328.2 people or 4.3% of the global population. About 90 million people in the US are immigrants and their US-born children. It has one of the highest immigration rates, with researchers predicting immigrants will account for 36% of the population by 2065. The UN estimates that the US, alongside eight other countries, will account for half of the global population by 2050.

Indonesia and Pakistan complete the list of five of the world’s most populous countries. Indonesia has a population of 270.6 million people, while the Pakistani population is 216.6 million, or 3.6% and 2.83% of the global population respectively. Statistics show that the Indonesian population grew by about 1.1% annually between 2009 and 2019, while the Pakistani population grew by 1.45% annually during the same period. Indonesia is home to the world’s most populous island, Java.
Brazil and Nigeria are the most populous countries in South America and Africa respectively. Brazil’s population is approximately 211 million (2.76%), while Nigeria has about 201 million people (2.63%). According to the UN, Brazil’s population will peak at 238 million in 2050. The main factor contributing to the country’s population growth is immigration from Africa, Europe, and other parts of the world. Nigeria is home to about 15.5% of the African population. There are over 85 million more people in the country than Africa’s second-most populous country (Ethiopia with 115 million people). The Nigerian population growth is driven by a high fertility rate and preference for large families. The UN predicts Nigeria will overtake the US as the third-most populous country by 2050.
Bangladesh is the world’s 8th most populous country, with a population of approximately 163 million people. The country’s population, representing 2.13% of the global population, is almost half the US population.
Russian Federation, the world’s largest country by area, is the 9th populous country with 144.4 million people, or 1.9% of the global population. It is one of the countries in Europe that have experienced a mix of population growth and decline in the last three decades. Russia had 148 million people in 1990, but the population dropped to 146.6 million in 2000 and 142 million in 2010. However, between 2010 and 2019, the population grew by close to 2 million people.
Mexico completes the list of ten most populous countries, with 127.6 million people, or 1.7% of the global population. Mexico’s population is almost one-third of the US population despite the two countries sharing a land border. In fact, it is one of the largest sources of immigrants into the US.
Bottom 5 Countries By Population
The five least populous countries have a total of 77,000 people, almost half that of Guam, the US an unincorporated territory. These countries are also the world’s smallest countries by land size.
Vatican City, an enclave of Rome, Italy, is the world’s least populous country with approximately 825 people. The population is mainly composed of religious leaders and members such as priests and laypeople. All the city-state’s residents are Catholics.
With a population of 11,650, Tuvalu is the second-least populated country. The island country has a 0.86% population growth rate. Tuvalu’s population has been rising steadily in the last three decades due to the high birth rate and lower death rate.

Nauru is the 4th least populated country with a population of about 12,580 people. Between 1996 and 2006, the country experienced a significant population decline from 10,672 to 9,878. The repatriation of immigrant workers back to their countries contributed to the decline. Although the country experienced a period of population growth between 2006 and 2016, the population has been on a steady decline since then.
Palau and San Marino complete the list of five least populated countries, with 18,000 and 33,860 people respectively. Palau is an island country made up of 340 islands, with two-thirds of its population living on Koror Island.
5 Most Densely And 5 Most Sparsely Populated Countries
|
Rank |
Country |
Population Density (people per sq. km of land area) |
|---|---|---|
|
1 |
Monaco |
19,196 |
|
2 |
Singapore |
7,953 |
|
3 |
Bahrain |
2,017 |
|
4 |
Maldives |
1,719 |
|
5 |
Malta |
1,514 |
Table: 5 most densely populated countries in the world. Source: World Bank
The global population is 7.63 billion and the Earth’s total surface area is 510.1 million square kilometers. Therefore, the world’s population density is about 15 people per square kilometers. However, if the only land area (150 million square miles) is considered, the population density is 50.9 people per square kilometer. However, this number does not give a true reflection of the population density since some parts of the world like deserts and high mountains are uninhabitable. According to the World Bank, the Earth’s population density is 59.62 people per square kilometers (2018)
Monaco, a city-state bordered by France, is the world’s most densely populated sovereign state with 19,196 people per square kilometer. Monaco is the world’s second-smallest country by size, covering 2.1 square kilometers. It has a population of about 39,000 residents.
Singapore is the 176th largest country with a surface area of 728 square kilometers. With a population of 5.7 million people, it has a population density of 7,953 people per square mile, making it the second-most densely populated country.
Bahrain is the most densely populated country that is not a city-state, with 2,017 people per square kilometers. It covers an area of approximately 780 square kilometers (Asia’s 3rd smallest country) and has a population of about 1.6 million people. Maldives and Malta are the 4th and 5th most densely populated countries, with 1,719 and 1,514 people per square kilometer.
|
Rank |
Country |
Population Density (people per sq. km of land area) |
|---|---|---|
|
1 |
Mongolia |
2 |
|
2 |
Namibia |
3 |
|
3 |
Australia |
3 |
|
4 |
Iceland |
4 |
|
5 |
Suriname |
4 |
Table: 5 most least populated countries in the world. Source: World Bank
Mongolia is the world’s most sparsely populated country, with just 2 people per square kilometer. It covers 1.6 million square kilometers and has a population of about 3.3 million people. Namibia and Australia are the second-most sparsely populated countries, with 3 people per square kilometer. Namibia is Sub-Sahara Africa’s driest country. It covers 825,615 square kilometers and has a population of 2.75 million people. Although Australia is the world’s 6th largest country (7.7 million square kilometers), it has a population of 25.7 million people.
Iceland and Suriname are the 4th and 5th most sparsely populated countries with 2.1 and 2.9 people per square kilometer. Iceland covers an area of about 103,000 square kilometers and is home to 357,000 people. However, the majority of the people live in the southwest regions. Suriname is inhabited by about 542,000 people and covers 163,821 square kilometers, with forest accounting for 80% of the total land area.
Population Distribution Across The World
According to the latest United Nations report, the global population is 7.6 billion (2019). The global population has grown by approximately 6.8 billion from 1 billion in 1800. However, the population growth rate has declined from 2.2% to 1.1% in the last five decades. Despite positive population growth, world regions and continents have experienced mixed growth over the years.
Continents/Regions Where Population Is Increasing
Most continents and world regions, with a few exceptions, continue to experience robust population growth. Asia, the world’s largest continent by size and population, is one of the continents where the population is increasing. Asia-Pacific region had a population of about 4.3 billion or 60% of the world’s population in 2013. Currently, there are over 4.5 billion people in Asia, including 2.3 billion in East Asia and Pacific and 1.8 billion in South Asia. The continent hosts two of the world’s most populous countries; China and India. Although Asia is experiencing population growth, the growth rate has slowed down to 0.96%.
Besides Asia sub-regions, Sub-Sahara Africa is also experiencing positive population growth. Sub-Sahara Africa comprises African countries lying south of the Sahara Desert. This region has a population of approximately 1.1 billion people (2019), up from 845.7 million in 2009. With a population growth rate of 2.3% per annum, the UN predicts the region’s population will be 2-2.5 billion by 2050.
Europe and Central Europe region has a population of about 921.1 million people or 12.1% of the total world’s population. The region experienced steady population growth between 1960 and 1993, with a 1.2% annual growth rate. However, it experienced a less than 0.5% growth rate between 1994 and 2004. Although the region has a comparatively low population growth rate, most countries have a growing population due to increased life expectancy and immigration.
Regions Where Population Is Decreasing
Central Europe and Baltic is probably the only region globally that has consistently recorded a decline in population over the last three decades. It has a population of approximately 102.3 million, down from 110.8 million in 1989, or -8.3% population growth.
Most Populous Countries By 2100
|
Rank |
Country |
Estimated Population (2100) |
|---|---|---|
|
1 |
India |
1,090,000,000 |
|
2 |
Nigeria |
791,000,000 |
|
3 |
China |
732,000,000 |
|
4 |
United States |
336,000,000 |
|
5 |
Pakistan |
248,000,000 |
|
6 |
DR Congo |
246,000,000 |
|
7 |
Indonesia |
229,000,000 |
|
8 |
Ethiopia |
223,000,000 |
|
9 |
Egypt |
199,000,000 |
|
10 |
Tanzania |
186,000,000 |
Table: 10 Most Populous Countries In 2100. Source: Weforum.org
According to the UN projections, the global population will be over 11 billion by the end of the 21st century. Although the global population will rise steadily in the coming years, it may peak at 9.7 billion around 2064. It is projected that African countries will dominate the list of top ten largest countries by population. Only China, India, the US, Pakistan, and Indonesia will appear on the top ten list in 2100.
India will surpass China as the world’s most populous country, with 1.1 billion people, despite an overall decline in population growth. Nigeria, Africa’s most populous country, will be the second-most populous country with 791 people. Nigeria, over ten times smaller than the US, will continue to experience a steady population growth beyond 2100, mainly because of the high fertility rate and cultural factors such as the need for large families. China’s population will contract by almost half to about 730 million people, while the US population may grow by about 10 million to 336 million, making it the fourth most populous country. DRC, Ethiopia, Egypt, and Tanzania will also feature in the list of ten most populous countries by 2100.
Sub-Saharan Africa will continue to experience population growth by 2100 because of several factors. One of the reasons for population growth in Africa is the high fertility levels. In most African countries, the fertility rate is at least 3.5 births per woman. In the DRC, the fertility rate is 4.53 births per woman, while Nigeria’s fertility rate is 4.85 births per woman. Besides fertility levels, early motherhood will also contribute to the population rise. Most women become mothers at early ages, enabling them to carry multiple pregnancies. Other factors include a cultural preference for large families and falling mortality rates.
Countries By Population
The table below lists the countries of the world by total population (in thousands).
| Rank | Country | Total Population |
|---|---|---|
| 1 |
China |
1,397,715,000 |
| 2 |
India |
1,366,417,750 |
| 3 |
United States |
328,239,520 |
| 4 |
Indonesia |
270,625,570 |
| 5 |
Pakistan |
216,565,320 |
| 6 |
Brazil |
211,049,530 |
| 7 |
Nigeria |
200,963,600 |
| 8 |
Bangladesh |
163,046,160 |
| 9 |
Russian Federation |
144,373,540 |
| 10 |
Mexico |
127,575,530 |
| 11 |
Japan |
126,264,930 |
| 12 |
Ethiopia |
112,078,730 |
| 13 |
Philippines |
108,116,620 |
| 14 |
Egypt, Arab Rep. |
100,388,070 |
| 15 |
Vietnam |
96,462,110 |
| 16 |
Congo, Dem. Rep. |
86,790,570 |
| 17 |
Turkey |
83,429,620 |
| 18 |
Germany |
83,132,800 |
| 19 |
Iran, Islamic Rep. |
82,913,910 |
| 20 |
Thailand |
69,625,580 |
| 21 |
France |
67,059,890 |
| 22 |
United Kingdom |
66,834,400 |
| 23 |
Italy |
60,297,400 |
| 24 |
South Africa |
58,558,270 |
| 25 |
Tanzania |
58,005,460 |
| 26 |
Myanmar |
54,045,420 |
| 27 |
Kenya |
52,573,970 |
| 28 |
Korea, Rep. |
51,709,100 |
| 29 |
Colombia |
50,339,440 |
| 30 |
Spain |
47,076,780 |
| 31 |
Argentina |
44,938,710 |
| 32 |
Ukraine |
44,385,150 |
| 33 |
Uganda |
44,269,590 |
| 34 |
Algeria |
43,053,050 |
| 35 |
Sudan |
42,813,240 |
| 36 |
Iraq |
39,309,780 |
| 37 |
Afghanistan |
38,041,750 |
| 38 |
Poland |
37,970,870 |
| 39 |
Canada |
37,589,260 |
| 40 |
Morocco |
36,471,770 |
| 41 |
Saudi Arabia |
34,268,530 |
| 42 |
Uzbekistan |
33,580,650 |
| 43 |
Peru |
32,510,450 |
| 44 |
Malaysia |
31,949,780 |
| 45 |
Angola |
31,825,290 |
| 46 |
Ghana |
30,417,860 |
| 47 |
Mozambique |
30,366,040 |
| 48 |
Yemen, Rep. |
29,161,920 |
| 49 |
Nepal |
28,608,710 |
| 50 |
Venezuela, RB |
28,515,830 |
| 51 |
Madagascar |
26,969,310 |
| 52 |
Cameroon |
25,876,380 |
| 53 |
Cote d'Ivoire |
25,716,540 |
| 54 |
Korea, Dem. People's Rep. |
25,666,160 |
| 55 |
Australia |
25,364,310 |
| 56 |
Niger |
23,310,720 |
| 57 |
Sri Lanka |
21,803,000 |
| 58 |
Burkina Faso |
20,321,380 |
| 59 |
Mali |
19,658,030 |
| 60 |
Romania |
19,356,540 |
| 61 |
Chile |
18,952,040 |
| 62 |
Malawi |
18,628,750 |
| 63 |
Kazakhstan |
18,513,930 |
| 64 |
Zambia |
17,861,030 |
| 65 |
Ecuador |
17,373,660 |
| 66 |
Netherlands |
17,332,850 |
| 67 |
Syrian Arab Republic |
17,070,130 |
| 68 |
Guatemala |
16,604,030 |
| 69 |
Cambodia |
16,486,540 |
| 70 |
Senegal |
16,296,360 |
| 71 |
Chad |
15,946,880 |
| 72 |
Somalia |
15,442,910 |
| 73 |
Zimbabwe |
14,645,470 |
| 74 |
Guinea |
12,771,250 |
| 75 |
Rwanda |
12,626,950 |
| 76 |
Benin |
11,801,150 |
| 77 |
Tunisia |
11,694,720 |
| 78 |
Burundi |
11,530,580 |
| 79 |
Bolivia |
11,513,100 |
| 80 |
Belgium |
11,484,060 |
| 81 |
Cuba |
11,333,480 |
| 82 |
Haiti |
11,263,080 |
| 83 |
South Sudan |
11,062,110 |
| 84 |
Dominican Republic |
10,738,960 |
| 85 |
Greece |
10,716,320 |
| 86 |
Czech Republic |
10,669,710 |
| 87 |
Sweden |
10,285,450 |
| 88 |
Portugal |
10,269,420 |
| 89 |
Jordan |
10,101,690 |
| 90 |
Azerbaijan |
10,023,320 |
| 91 |
United Arab Emirates |
9,770,530 |
| 92 |
Hungary |
9,769,950 |
| 93 |
Honduras |
9,746,120 |
| 94 |
Belarus |
9,466,860 |
| 95 |
Tajikistan |
9,321,020 |
| 96 |
Israel |
9,053,300 |
| 97 |
Austria |
8,877,070 |
| 98 |
Papua New Guinea |
8,776,110 |
| 99 |
Switzerland |
8,574,830 |
| 100 |
Togo |
8,082,370 |
| 101 |
Sierra Leone |
7,813,220 |
| 102 |
Lao PDR |
7,169,450 |
| 103 |
Paraguay |
7,044,640 |
| 104 |
Bulgaria |
6,975,760 |
| 105 |
Serbia |
6,944,980 |
| 106 |
Lebanon |
6,855,710 |
| 107 |
Libya |
6,777,450 |
| 108 |
Nicaragua |
6,545,500 |
| 109 |
Kyrgyz Republic |
6,456,900 |
| 110 |
El Salvador |
6,453,550 |
| 111 |
Turkmenistan |
5,942,090 |
| 112 |
Denmark |
5,818,550 |
| 113 |
Singapore |
5,703,570 |
| 114 |
Finland |
5,520,310 |
| 115 |
Slovak Republic |
5,454,070 |
| 116 |
Congo, Rep. |
5,380,510 |
| 117 |
Norway |
5,347,900 |
| 118 |
Costa Rica |
5,047,560 |
| 119 |
Oman |
4,974,990 |
| 120 |
Ireland |
4,941,440 |
| 121 |
Liberia |
4,937,370 |
| 122 |
New Zealand |
4,917,000 |
| 123 |
Central African Republic |
4,745,190 |
| 124 |
Palestine |
4,685,310 |
| 125 |
Mauritania |
4,525,700 |
| 126 |
Panama |
4,246,440 |
| 127 |
Kuwait |
4,207,080 |
| 128 |
Croatia |
4,067,500 |
| 129 |
Georgia |
3,720,380 |
| 130 |
Uruguay |
3,461,730 |
| 131 |
Bosnia and Herzegovina |
3,301,000 |
| 132 |
Mongolia |
3,225,170 |
| 133 |
Eritrea |
3,213,970 |
| 134 |
Armenia |
2,957,730 |
| 135 |
Jamaica |
2,948,280 |
| 136 |
Albania |
2,854,190 |
| 137 |
Qatar |
2,832,070 |
| 138 |
Lithuania |
2,786,840 |
| 139 |
Moldova |
2,657,640 |
| 140 |
Namibia |
2,494,530 |
| 141 |
Gambia, The |
2,347,710 |
| 142 |
Botswana |
2,303,700 |
| 143 |
Gabon |
2,172,580 |
| 144 |
Lesotho |
2,125,270 |
| 145 |
Slovenia |
2,087,950 |
| 146 |
North Macedonia |
2,083,460 |
| 147 |
Guinea-Bissau |
1,920,920 |
| 148 |
Latvia |
1,912,790 |
| 149 |
Bahrain |
1,641,170 |
| 150 |
Trinidad and Tobago |
1,394,970 |
| 151 |
Equatorial Guinea |
1,355,990 |
| 152 |
Estonia |
1,326,590 |
| 153 |
Timor-Leste |
1,293,120 |
| 154 |
Mauritius |
1,265,710 |
| 155 |
Cyprus |
1,198,580 |
| 156 |
Eswatini |
1,148,130 |
| 157 |
Djibouti |
973,560 |
| 158 |
Fiji |
889,950 |
| 159 |
Comoros |
850,890 |
| 160 |
Guyana |
782,770 |
| 161 |
Bhutan |
763,090 |
| 162 |
Solomon Islands |
669,820 |
| 163 |
Montenegro |
622,140 |
| 164 |
Luxembourg |
619,900 |
| 165 |
Suriname |
581,360 |
| 166 |
Cabo Verde |
549,930 |
| 167 |
Maldives |
530,950 |
| 168 |
Malta |
502,650 |
| 169 |
Brunei Darussalam |
433,290 |
| 170 |
Belize |
390,350 |
| 171 |
Bahamas, The |
389,480 |
| 172 |
Iceland |
361,310 |
| 173 |
Vanuatu |
299,880 |
| 174 |
Barbados |
287,020 |
| 175 |
Sao Tome and Principe |
215,060 |
| 176 |
Samoa |
197,100 |
| 177 |
St. Lucia |
182,790 |
| 178 |
Kiribati |
117,610 |
| 179 |
Micronesia, Fed. Sts. |
113,810 |
| 180 |
Grenada |
112,000 |
| 181 |
St. Vincent and the Grenadines |
110,590 |
| 182 |
Tonga |
104,490 |
| 183 |
Seychelles |
97,630 |
| 184 |
Antigua and Barbuda |
97,120 |
| 185 |
Andorra |
77,140 |
| 186 |
Dominica |
71,810 |
| 187 |
Marshall Islands |
58,790 |
| 188 |
St. Kitts and Nevis |
52,830 |
| 189 |
Monaco |
38,960 |
| 190 |
Liechtenstein |
38,020 |
| 191 |
San Marino |
33,860 |
| 192 |
Palau |
18,010 |
| 193 |
Nauru |
12,580 |
| 194 |
Tuvalu |
11,650 |
| 195 |
Vatican City |
825 |
Table: Countries by population. Source: World Bank
Territories/Dependencies By Population
The following table shows the population of territories and dependencies. These geographic entities are not strictly considered to be countries, but rather are related to other countries.
| Rank | Territory/Dependency | Related Country | Total Population |
|---|---|---|---|
|
1 |
Taiwan |
China |
23,568,378 |
|
2 |
Hong Kong |
China |
7,500,700 |
|
3 |
Puerto Rico |
United States |
3,193,694 |
|
4 |
Kosovo |
Disputed, claimed by Serbia |
1,873,160 |
|
5 |
Macau |
China |
682,800 |
|
6 |
French Polynesia |
France |
275,918 |
|
7 |
New Caledonia |
France |
271,407 |
|
8 |
Guam |
United States |
168,485 |
|
9 |
Curacao |
Netherlands |
163,424 |
|
10 |
Aruba |
Netherlands |
116,576 |
|
11 |
Jersey |
United Kingdom |
107,800 |
|
12 |
Isle of Man |
United Kingdom |
83,314 |
|
13 |
Saint Martin |
France |
77,741 |
|
14 |
Bermuda |
United Kingdom |
71,176 |
|
15 |
Cayman Islands |
United Kingdom |
65,813 |
|
16 |
Guernsey |
United Kingdom |
62,792 |
|
17 |
Greenland |
Denmark |
56,225 |
|
18 |
American Samoa |
United States |
55,100 |
|
19 |
Northern Mariana Islands |
United States |
53,883 |
|
20 |
Faroe Islands |
Denmark |
52,110 |
|
21 |
Turks and Caicos Islands |
United Kingdom |
42,953 |
|
22 |
Sint Maarten |
Netherlands |
41,486 |
|
23 |
Gibraltar |
United Kingdom |
34,003 |
|
24 |
British Virgin Islands |
United Kingdom |
30,030 |
|
25 |
Dhekelia and Akrotiri |
United Kingdom |
18,195 |
|
26 |
Cook Islands |
New Zealand |
17,459 |
|
27 |
Anguilla |
United Kingdom |
14,731 |
|
28 |
Wallis and Futuna |
France |
11,558 |
|
29 |
Saint Barthelemy |
France |
9,961 |
|
30 |
Saint Pierre and Miquelon |
France |
5,997 |
|
31 |
Saint Helena, Ascension, and Tristan da Cunha |
United Kingdom |
5,633 |
|
32 |
Montserrat |
United Kingdom |
4,649 |
|
33 |
Falkland Islands (Islas Malvinas) |
United Kingdom |
3,398 |
|
34 |
Svalbard |
Norway |
2,939 |
|
35 |
Christmas Island |
Australia |
1,843 |
|
36 |
Norfolk Island |
Australia |
1,748 |
|
37 |
Niue |
New Zealand |
1,620 |
|
38 |
Tokelau |
New Zealand |
1,499 |
|
39 |
Paracel Islands |
Disputed between China, Vietnam, and Taiwan |
Over 1000 |
|
40 |
Cocos (Keeling) Islands |
Australia |
544 |
|
41 |
Pitcairn Islands |
United Kingdom |
50 |
Table: Territories/Dependencies by population.