Average Educational Levels In The U.S.A. By State
The Educational System Of The US
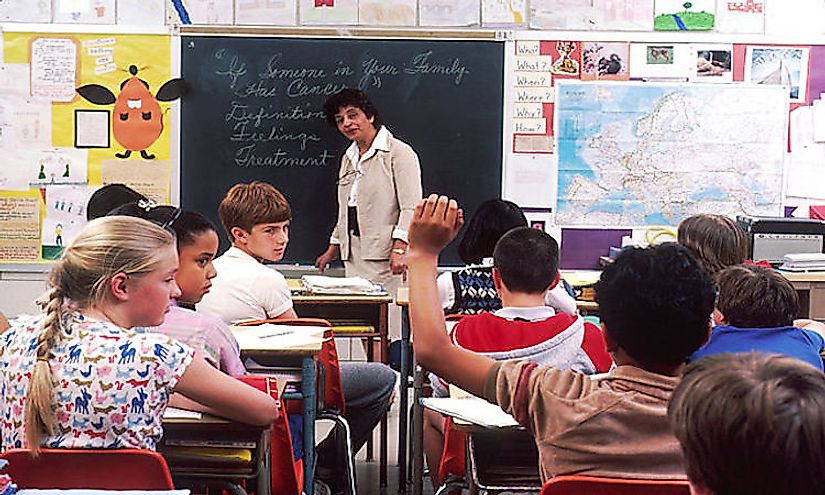
The educational system in the US is made up of a combination of public, private, and at-home schools, although the public school system is the most common. Public schools receive funding from local, state, and federal governments. Kindergarten through 12th grade is mandated by the federal government and available to everyone. Children usually begin kindergarten around age 5. Local school boards, whose members are elected by the community, administer separate school districts. These individuals make decisions about school policy, budget allocation, and curriculum design. The state government typically defines standards of learning, which are often tested via standardized exams.
Literacy Rates of the US
Although the US spends more money per student than any other country in the world, the educational system only ranks as the 14th best. The percentage of US residents who are literate, able to read and write, ranges between 65% and 85%. This wide range is due to a difference in how literacy is measured. Approximately 15% of the population can read at a university Bachelor’s degree level. The majority of Americans are able to read at a 7th or 8th-grade level.
Literacy Rate By State
This section takes a look at which states have the highest percentage of educational attainment at 3 levels: High School (the completion of which is mandatory unless the student has parental permission to withdraw at age 16), Bachelor’s/Undergraduate, and Advanced/Graduate.
High School Graduates
The top 5 US states with the highest percentage of high school graduates are Wyoming (91.8%), Minnesota (91.7%), Alaska (91.4%), Iowa (91.4%), and New Hampshire (91.3%).
Bachelor’s Degree Holders
The 5 highest ranking US states with the highest percentage of Bachelor’s Degrees are Washington DC (48.5%), Massachusetts (38.2%), Maryland (37.3%), Colorado (35.9%), and Connecticut (35.6%).
Advanced Degree Holders
The top 5 states with the highest percentage of Advanced Degrees are Washington DC (28%), Massachusetts (16.4%), Maryland (16%), Connecticut (15.5%), and Virginia (14.1%).
Reason For Low Attainment Of University Level Education
The US has fallen behind several countries around the world in terms of educational mobility and university-level educational attainment. The number of young people attending and graduating from university has in the past surpassed the numbers of the previous generation. Today, however, that is not always true, and fewer young adults are getting a higher education than their parents. Several factors attribute to this trend.
One of the biggest reasons that fewer individuals are going to university is the cost. Tuition costs at public universities have drastically increased over the last few decades leading to less equitable access to education. This indicates that those from lower socioeconomic classes have a more difficult time paying for and attending university.
Today, earning a middle-class salary is more difficult with lower levels of education than it once was. People without university degrees are more likely to work in minimum wage jobs. This creates a fierce competition for these jobs between US citizens without a university degree and the immigrants who apply for the same type of jobs for lower salaries. Some researchers believe that this competition has led to increased levels of unemployment among lower-educated US citizens. However, many other researchers have published studies to the contrary, claiming that immigration inflow and increasing unemployment rates are not correlated.
US Literacy Rate By State
| Rank | State | % High school graduate | % Bachelor's degree | % Advanced degree |
|---|---|---|---|---|
| 1 | Alabama | 82.1% | 22.0% | 7.7% |
| 2 | Alaska | 91.4% | 26.6% | 9.0% |
| 3 | Arizona | 84.2% | 25.6% | 9.3% |
| 4 | Arkansas | 82.4% | 18.9% | 6.1% |
| 5 | California | 80.6% | 29.9% | 10.7% |
| 6 | Colorado | 89.3% | 35.9% | 12.7% |
| 7 | Connecticut | 88.6% | 35.6% | 15.5% |
| 8 | Delaware | 87.4% | 28.7% | 11.4% |
| 9 | District of Columbia | 87.1% | 48.5% | 28.0% |
| 10 | Florida | 85.3% | 25.3% | 9.0% |
| 11 | Georgia | 83.9% | 27.5% | 9.9% |
| 12 | Hawaii | 90.4% | 29.6% | 9.9% |
| 13 | Idaho | 88.4% | 23.9% | 7.5% |
| 14 | Illinois | 86.4% | 30.6% | 11.7% |
| 15 | Indiana | 86.6% | 22.5% | 8.1% |
| 16 | Iowa | 91.4% | 25.1% | 7.4% |
| 17 | Kansas | 89.7% | 29.5% | 10.2% |
| 18 | Kentucky | 81.7% | 21.0% | 8.5% |
| 19 | Louisiana | 82.2% | 21.4% | 6.9% |
| 20 | Maine | 90.2% | 26.9% | 9.6% |
| 21 | Maryland | 89.0% | 37.3% | 16.0% |
| 22 | Massachusetts | 89.0% | 38.2% | 16.4% |
| 23 | Michigan | 87.9% | 24.6% | 9.4% |
| 24 | Minnesota | 91.7% | 31.5% | 10.3% |
| 25 | Mississippi | 80.4% | 19.6% | 7.1% |
| 26 | Missouri | 86.8% | 25.2% | 9.5% |
| 27 | Montana | 90.8% | 27.4% | 8.3% |
| 28 | Nebraska | 89.8% | 27.4% | 8.8% |
| 29 | Nevada | 83.9% | 21.8% | 7.6% |
| 30 | New Hampshire | 91.3% | 32.0% | 11.2% |
| 31 | New Jersey | 87.4% | 34.5% | 12.9% |
| 32 | New Mexico | 82.8% | 25.3% | 10.4% |
| 33 | New York | 84.7% | 32.4% | 14.0% |
| 34 | North Carolina | 84.3% | 26.5% | 8.8% |
| 35 | North Dakota | 90.1% | 25.8% | 6.7% |
| 36 | Ohio | 87.6% | 24.1% | 8.8% |
| 37 | Oklahoma | 85.6% | 22.7% | 7.4% |
| 38 | Oregon | 89.1% | 29.2% | 10.4% |
| 39 | Pennsylvania | 87.9% | 26.4% | 10.2% |
| 40 | Rhode Island | 84.7% | 30.5% | 11.7% |
| 41 | South Carolina | 83.6% | 24.3% | 8.4% |
| 42 | South Dakota | 89.9% | 25.1% | 7.3% |
| 43 | Tennessee | 83.1% | 23.0% | 7.9% |
| 44 | Texas | 79.9% | 25.5% | 8.5% |
| 45 | Utah | 90.4% | 28.5% | 9.1% |
| 46 | Vermont | 91.0% | 33.1% | 13.3% |
| 47 | Virginia | 86.6% | 34.0% | 14.1% |
| 48 | Washington | 89.7% | 31.0% | 11.1% |
| 49 | West Virginia | 82.8% | 17.3% | 6.7% |
| 50 | Wisconsin | 89.8% | 25.7% | 8.4% |
| 51 | Wyoming | 91.8% | 23.8% | 7.9% |