Largest Ethnic Groups In Uganda
Uganda is an east African nation that shares borders with Kenya, Rwanda, South Sudan, Tanzania, and the Democratic Republic of the Congo. The earliest inhabitants of the area were hunter-gatherers. This lifestyle was slowly replaced by the arrival of the Bantu-speaking peoples between 1,700 and 2,300 years ago. Today, the population of Uganda is approximately 37.8 million and made up of various ethnic groups. Some of the largest of these groups in this country are discussed below.
Largest Ethnic Groups in Uganda
Baganda
The largest ethnic group in Uganda is the Baganda. People of Baganda origin make up 16.9% of the population. The Baganda belong to the Bantu ethnic family and likely settled in the area between 1000 BC and 500 AD with the Bantu migration out of west Africa. The traditional language of this group is Luganda, belonging to the Niger-Congo language family. Culturally, they practice patrilineal descent. Several related lineages make up a clan. Today, there are 52 recognized Baganda clans in Uganda. When the British made contact, they discovered that the Baganda were highly organized with a significant military force. The British made their kingdom a protectorate and the Baganda king fought back unsuccessfully in 1897. By this time, contact with the British had led to a decrease in the population and the Baganda went from 3 million to only 1.5 million. In order to recover costs of the war, the British levied taxes on the kingdom in 1900 but also signed a treaty agreeing to the demands of the chiefs, namely giving them authority over a large territory. Uganda gained independence in 1962 and the new government disbanded the Baganda Kingdom. They have since reunited under the new system of monarchy.
Banyankole
The second largest ethnic group is the Banyankole, which makes up 9.5% of the population. The Banyankole primarily reside in the southwestern region of Uganda. They traditionally speak a Bantu language called Runyankole. The primary economic activity of the Banyankole is raising cattle. Today, the majority of these individuals practice Christianity, although the customary belief in ancestor spirits continues. When their kingdom was prohibited in 1962, the Banyankole fought the new, independent government. When monarchism was restored in 1993, the Banyankole were not united in their desire to reestablish the kingdom. To this day they have not resolved their differences.
Basoga
The Basoga ethnic group makes up 8.4% of the population, which makes them the third largest ethnic group. Their traditional language is Soga, belonging to the Bantu language family. Land was owned by clans and managed by the head of the clan. Ownership could not pass to another clan The Basoga, today, inhabit the area east of the Baganda kingdom. After contact with British colonialists in the late 1800’s, the Basoga suffered significant population loss. Most of this, however, was due to an outbreak of the sleeping disease. As a result, between 1900 and 1910 much of the kingdom was evacuated. Those who survived came back to area between 1920 and 1930, although another epidemic occurred in the 1940’s. This was followed by famine. The population size continued to decrease. Similar to the Baganda, when tribal monarchies were once again legalized, the Basoga reestablished their kingdom.
Other ethnic groups within Uganda can be found in the table below.
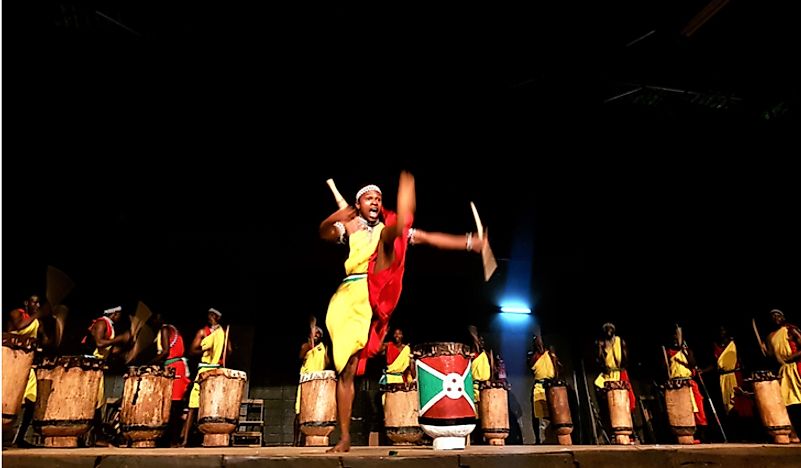
Ethnic Diversity
As mentioned above and illustrated in the chart below, Uganda has a high degree of ethnic diversity. In fact, the country is one of the most ethnically diverse in the world. It is home to more than 40 indigenous ethnic groups, each of which have their own culture, language, and customs.
Largest Ethnic Groups In Uganda
| Rank | Ethnic Group | Share of Contemporary Ugandan Population |
|---|---|---|
| 1 | Baganda | 16.9% |
| 2 | Banyankole | 9.5% |
| 3 | Basoga | 8.4% |
| 4 | Bakiga | 6.9% |
| 5 | Iteso | 6.4% |
| 6 | Langi | 6.1% |
| 7 | Acholi | 4.7% |
| 8 | Bagisu | 4.6% |
| 9 | Lugbara | 4.2% |
| Other Groups | 32.3% |